Category Archives: Data Science
R-squared & Adjusted R-squared: Differences, Examples
There are two measures of the strength of linear regression models: adjusted r-squared and r-squared. While they are both important, they measure different aspects of model fit. In this blog post, we will discuss the differences between adjusted r-squared and r-squared, as well as provide some examples to help illustrate their meanings. As a data scientist, it is of utmost importance to understand the differences between adjusted r-squared and r-squared in order to select the most appropriate linear regression model out of different regression models. What is R-squared? R-squared, also known as the coefficient of determination, is a measure of what proportion of the variance in the value of the …
Feature Scaling in Machine Learning: Python Examples
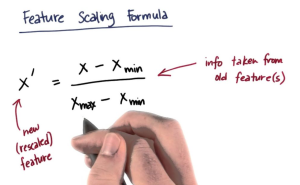
While training machine learning models, we come across the need for scaling features in order to have different features contribute to the predictions in an appropriate manner. Without scaling, features with larger numerical ranges can dominate those with smaller ranges, leading to biased or inefficient learning. In this post you will learn about this feature engineering technique namely feature scaling with Python code examples using which you could significantly improve performance of machine learning models. To demonstrate the technique, the models will be trained using Perceptron (single-layer neural network) classifier. What is Feature Scaling? Why is it needed? Feature scaling is a method used to standardize the range of independent variables …
Different Types of Statistical Tests: Concepts

Last updated: 18th Nov, 2023 Statistical tests are an important part of data analysis. They help us understand the data and make inferences about the population. They are used to examine relationships between variables based on hypothesis testing. They are a way of analyzing data to see if there is a significant difference between the two groups or a group and population. In statistics, there are two main types of tests: parametric and non-parametric. Both types of tests are used to make inferences about a population based on a sample. The difference between the two types of tests lies in the assumptions that they make about the data. Parametric tests …
Machine Learning – Sensitivity vs Specificity Differences, Examples
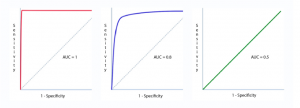
Last updated: 18th Nov, 2023 Machine learning (ML) models are increasingly being used to learn from data and make decisions or predictions based on that learning. When it comes to evaluating the performance of these ML models, there are several important metrics to consider. One of the most important metrics is the accuracy of the model, which is typically measured using sensitivity and specificity. Sensitivity and specificity are two important concepts often used in the context of classification tasks in machine learning. They help to evaluate the performance of a classification model. In this post, we will try and understand the concepts behind machine learning model evaluation metrics such as …
PCA vs LDA Differences, Plots, Examples
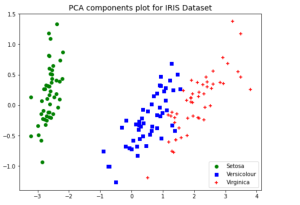
Last updated: 18th Nov, 2023 Dimensionality reduction is an important technique in data analysis and machine learning that allows us to reduce the number of variables in a dataset while retaining the most important information. By reducing the number of variables, we can simplify the problem, improve computational efficiency, and avoid overfitting. Two popular dimensionality reduction techniques are Principal Component Analysis (PCA) and Linear Discriminant Analysis (LDA). Both techniques aim to reduce the dimensionality of the dataset, but they differ in their objectives, assumptions, and outputs. But how do they differ, and when should you use one method over the other? As data scientists, it is important to get a …
Types & Uses of Moments in Statistics
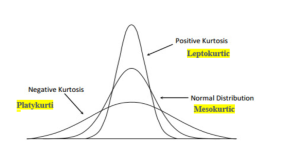
Last updated: 18th Nov, 2023 In statistics, moments are measures of the shape and variability of a data set. They are used to describe the location and dispersion of the data. There are several types of moments that can be calculated, each providing different information about the data set. Let’s take a look at some of these moments, its definitions, formula and examples highlighting how they can be used in statistical analysis. What are Moments in Statistics and what are their types? In statistics, moments are an important tool used to measure the characteristics of a distribution. Moments can provide useful information about the spread, shape, and center of a …
How to Add Rows to DataFrames in R Using dplyr: Examples

Data manipulation is a fundamental aspect of data analysis, and R, with its dplyr package, offers an efficient and readable way to perform such tasks. In my experience working with various datasets, I have often encountered situations where I needed to add rows to an existing DataFrame. The dplyr package, part of the tidyverse collection, makes these tasks intuitive and efficient. In this blog post, I’ll share two common scenarios: adding a single row and adding multiple rows to a DataFrame using dplyr. If you would want to learn about how to add rows to Pandas Dataframe using Python, check out my related post – Pandas Dataframe: How to Add …
Two samples Z-test for Means: Formula & Examples
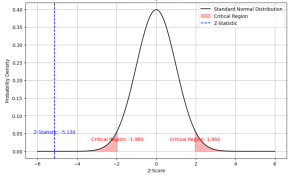
Last updated: 21st Nov, 2023 Statistical hypothesis testing is an essential tool in inferential statistics that enables researchers to make informed decisions about the population parameters based on sample statistics. One common hypothesis test for comparing two sample means is the Two-Sample Z-Test. In statistics, a two-sample z-test for means is used to determine if the means of two populations are equal. This test is used when the population standard deviations are known. As data scientists, it is of utmost importance to be able to understand and conduct this test accurately. In this blog, we will delve deeper into the Two-Sample Z-Test for means, exploring its formula, assumptions, and examples …
Histogram Plots using Matplotlib & Pandas: Python

Executing the above code will print the following Histogram. Plotting multiple Histograms Side-by-Side using Matplotlib & Pandas When you want to understand the distribution of data with respect to different characteristics, you could plot the side-by-side or multiple histograms on the same plot. For example, when you want to understand the distribution of housing prices with respect to different values of accessibility to radial highways, you would want to print the histograms side-by-side on the same plot. Here is the code representing the printing of histogram plots side-by-side on the same plot: Here is how the side-by-side histogram plot would look like: Creating Stacked Histogram Plots using Matplotlib & Pandas …
Confusion Matrix Concepts, Python Code Examples
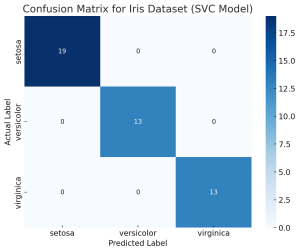
The confusion matrix is an essential tool in the field of machine learning and statistics for evaluating the performance of a classification model. It’s particularly useful when dealing with binary or multi-class classification problems. In this post, you will learn about the confusion matrix with examples and how it could be used as performance metrics for classification models in machine learning. What is Confusion Matrix? A confusion matrix is a table used to describe the performance of a classification model on a set of test data for which the true values are known. It’s most useful when you need to know more about the accuracy of the model than just …
Maximum Likelihood Estimation: Concepts, Examples

Maximum Likelihood Estimation (MLE) is a fundamental statistical method for estimating the parameters of a statistical model that make the observed data most probable. MLE is grounded in probability theory, providing a strong theoretical basis for parameter estimation. This is becoming more so important to learn fundamentals of MLE concepts as it is at the core of generative modeling (generative AI). Many models used in machine learning and statistics are based on MLE, including logistic regression, survival models, and various types of machine learning algorithms. MLE is particularly important for data scientists because it underpins many of the probabilistic machine learning models that are used today. These models, which are …
Wilcoxon Signed Rank Test: Concepts, Examples
How can data scientists accurately analyze data when faced with non-normal distributions or small sample sizes? This is a challenge that often arises in the dynamic field of data science, where making precise inferences is crucial. Enter the Wilcoxon Signed Rank Test—a non-parametric statistical method that stands as a powerful alternative to the traditional t-test. This blog post aims to unravel the concepts and practical applications of the Wilcoxon Signed Rank Test, offering key insights for data scientists and researchers navigating complex data landscapes. The beauty of the Wilcoxon Signed Rank Test lies in its wide applicability across numerous fields. From healthcare, where it can compare the efficacy of different …
R-squared in Linear Regression Models: Concepts, Examples
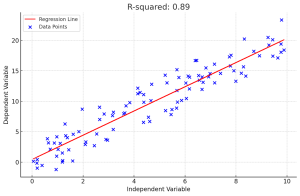
In linear regression, R-squared (R2) is a measure of how close the data points are to the fitted line. It is also known as the coefficient of determination. Understanding the concept of R-squared is crucial for data scientists as it helps in evaluating the goodness of fit in linear regression models, compare the explanatory power of different models on the same dataset and communicate the performance of their models to stakeholders. In this post, you will learn about the concept of R-Squared in relation to assessing the performance of multilinear regression machine learning model with the help of some real-world examples explained in a simple manner. Before doing a deep dive, …
Hierarchical Clustering: Concepts, Python Example
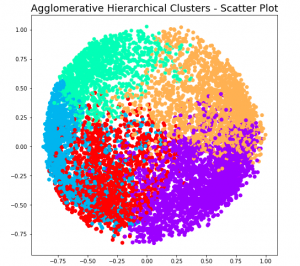
Hierarchical clustering a type of unsupervised machine learning algorithm that stands out for its unique approach to grouping data points. Unlike its counterparts, such as k-means, it doesn’t require the predetermined number of clusters. This feature alone makes it an invaluable method for exploratory data analysis, where the true nature of data is often hidden and waiting to be discovered. But the capabilities of hierarchical clustering go far beyond just flexibility. It builds a tree-like structure, a dendrogram, offering insights into the data’s relationships and similarities, which is more than just clustering—it’s about understanding the story your data wants to tell. In this blog, we’ll explore the key features that …
Minimum Description Length (MDL): Formula, Examples
Learning the concepts of Minimum Description Length (MDL) is valuable for several reasons, especially for those involved in statistics, machine learning, data science, and related fields. One of the fundamental problems in statistics and data analysis is choosing the best model from a set of potential models. The challenge is to find a model that captures the essential features of the data without overfitting. This is where methods such as MDL, AIC, BIC, etc. comes to rescue. MDL offers a principled way to balance model complexity against the goodness of fit. This is crucial in many areas, such as machine learning and statistical modeling, where overfitting is a common problem. …
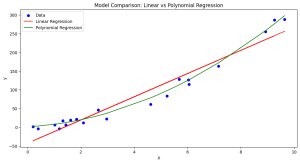
Linear Regression Datasets: CSV, Excel

Linear regression is a fundamental machine learning algorithm that helps in understanding the relationship between independent and dependent variables. It is widely used in various fields for predicting numerical outcomes based on one or more input features. To practice and learn about linear regression, it is essential to have access to good quality datasets. In this blog, we have compiled a list of 17 datasets suitable for training linear regression models, available in CSV or easily convertible to CSV (Excel) format. I have also provided a sample Python code you can use to train using these datasets. List of Dataset for Training Linear Regression Models The following is a list …
I found it very helpful. However the differences are not too understandable for me