
Last updated: 18th Nov, 2023
In statistics, moments are measures of the shape and variability of a data set. They are used to describe the location and dispersion of the data. There are several types of moments that can be calculated, each providing different information about the data set. Let’s take a look at some of these moments, its definitions, formula and examples highlighting how they can be used in statistical analysis.
What are Moments in Statistics and what are their types?
In statistics, moments are an important tool used to measure the characteristics of a distribution. Moments can provide useful information about the spread, shape, and center of a distribution.
The following are definitions, formula and examples for different types of moments. For demonstrating concepts with the help of real-life examples, we will work with a sample dataset representing the heights (in centimeters) of a small group of individuals: {160,165,170,175,180,185}
- First moment (Mean) – Mean is the most commonly used measure of central tendency. It gives us an idea of where the data is centered in a distribution. The following is the formula of mean.
$ \mu = E(X) = \int_{-\infty}^{\infty} x f(x) dx $
The mean, represented as $ \mu = E(X) $ , is the cornerstone of central tendency in statistics. It’s calculated by integrating $xf(x)$ over all possible values of , where is the probability density function for continuous variables, or summing for discrete variables. The mean is a fundamental descriptor, providing a baseline for understanding the general “location” of a data set on the number line.
Here is calculation of mean using the sample dataset representing heights:
$ \text{Mean} = \frac{160 + 165 + 170 + 175 + 180 + 185}{6} = \frac{1035}{6} = 172.5 $
So, the average height in this group is 172.5 cm. - Second moment (Variance) – Variance measures how spread out or dispersed the data is around its mean value. The following is the formula of variance.
$ \sigma^2 = Var(X) = E[(X – \mu)^2] = \int_{-\infty}^{\infty} (x – \mu)^2 f(x) dx $
Variance, denoted as $ \sigma^2 = Var(X) $ , measures the spread of data around the mean. It’s the expectation of the squared deviation from the mean, $ E[(X – \mu)^2] $. In practice, a higher variance implies that the data points are more spread out from the mean, indicating greater variability within the dataset. It’s essential for understanding the dispersion in data.
Here is the calculation of variance using the sample dataset representing heights:
$ \text{Variance} = \frac{(160-172.5)^2 + (165-172.5)^2 + (170-172.5)^2 + (175-172.5)^2 + (180-172.5)^2 + (185-172.5)^2}{6} $
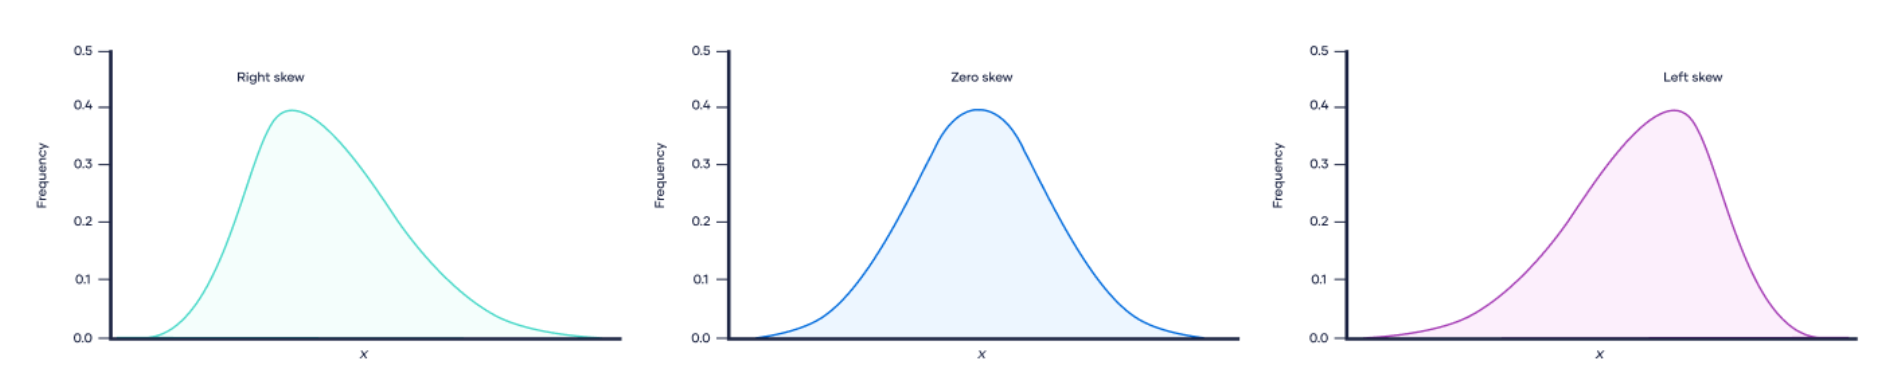
After calculating, you’ll find that the variance gives an idea of how much the heights vary from the average. - Third moment (Skewness) – Skewness measures the asymmetry of a distribution; it tells us if there are more values on one side than another side of the distribution (positively skewed, negatively skewed, or symmetric). A positive value of skew represents right-skewed distributions, a negative value of skew represents left-skewed distributions and a zero value of skewness indicates that the distribution is symmetric. The following picture demonstrates positive, negative, and zero-skewed datasets.
The following is the formula representing skewness:
$ \gamma_1 = E\left[\left(\frac{X – \mu}{\sigma}\right)^3\right] = \int_{-\infty}^{\infty} \left(\frac{x – \mu}{\sigma}\right)^3 f(x) dx $
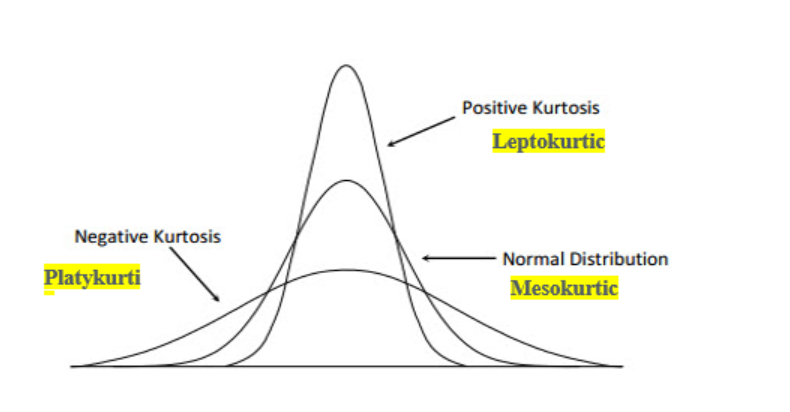
Skewness, $ \gamma_1 $, is a measure of the asymmetry of a distribution. It’s the third standardized moment and is calculated as the expected value of the cubed standardized deviations. - Fourth moment (Kurtosis) – Kurtosis measures the peaked ness or flatness of a distribution; it tells us how much weight is at the center and tail ends of the distribution (leptokurtic, platykurtic, or mesokurtic). Positive kurtosis indicates that the data is more concentrated near the mean than in a normal distribution, while negative kurtosis indicates that the data is spread out more than in a normal distribution. The following picture demonstrates leptokurtic, platykurtic, and mesokurtic datasets.

The formula for kurtosis is given by:
$ \text{Kurtosis} = E\left[\left(\frac{X – \mu}{\sigma}\right)^4\right] $
In this formula, kurtosis is defined as the expected value of the fourth power of the standardized deviations of a random variable from its mean (), scaled by its standard deviation ().
For continuous random variables, this expected value is calculated as an integral over the probability density function of :
$ \text{Kurtosis} = \int_{-\infty}^{\infty} \left(\frac{x – \mu}{\sigma}\right)^4 f(x) dx $
This kurtosis measure indicates the “tailedness” of the distribution. Unlike excess kurtosis, which adjusts the measure so that the kurtosis of a normal distribution is zero, this formula does not include the subtraction of 3.
Python Code Examples to Calculate Moments
The following is the Python code for creating a sample dataset whose moments will be calculated later.
import numpy as np
import matplotlib.pyplot as plt
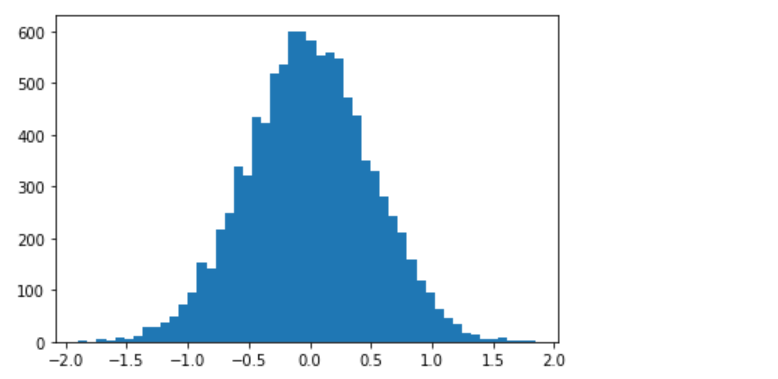
values = np.random.normal(0, 0.5, 10000)
plt.hist(values, 50)
plt.show()
The following plot gets printed representing the dataset.
The following python code represents moments for the above dataset.
import scipy.stats as sp
# First moment: Mean
mean = np.mean(values)
# Second moment: Variance
variance = np.var(values)
# Third moment: Skewness
skewness = sp.skew(values)
# Fourth moment: Kurtosis
kurtosis = sp.kurtosis(values)
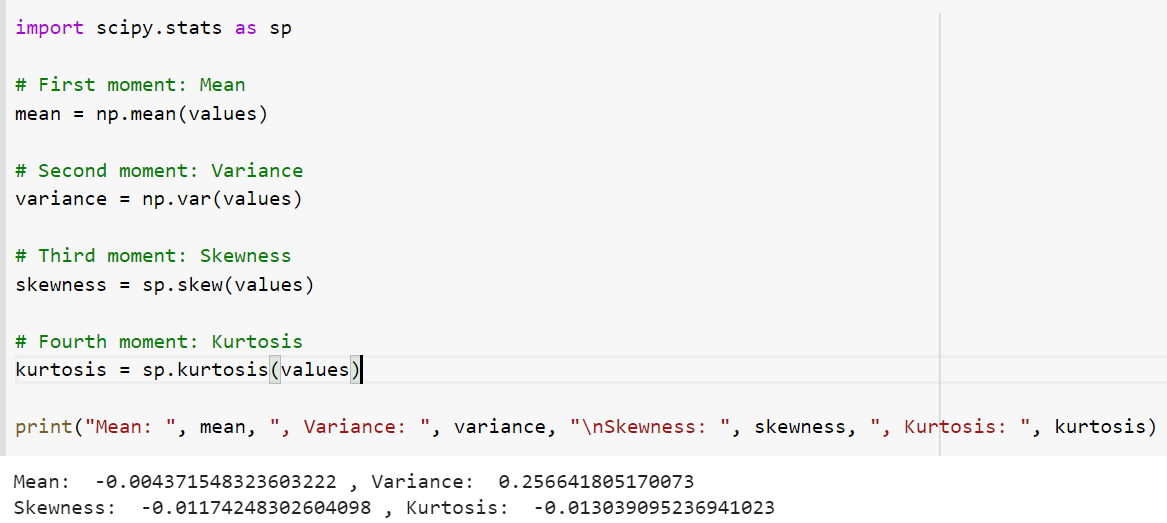
print("Mean: ", mean, ", Variance: ", variance, "\nSkewness: ", skewness, ", Kurtosis: ", kurtosis)
The following gets printed. Note that skewness is negative which indicates that the data is left-tailed (long tail in the left). Also, kurtosis is negative which means that larger data is present in tails.
What is the real-world usage of Moments in Statistics?
Moments in statistics are commonly used to quantify various aspects of a distribution, such as its central tendency, skewness, and kurtosis. For example, the mean (or average), variance, and standard deviation are all moments that can be used to characterize a dataset. Moments can also be used to measure the degree of clustering or dispersion in a dataset. These parameters are useful for describing the shape of a data distribution, which is an important factor in many statistical analyses.
In addition to providing descriptive information about a data set, moments can also be used to determine if two or more datasets have similar characteristics. For example, it is possible to compare the means, variances, and other moments between two datasets to determine if they are similar or different. This technique is often employed in financial analyses where comparing stock prices over time requires knowledge of their distributions. Another common use case for moments is in quality control processes where moments are calculated from random product samples to ensure that production remains consistent over time.
Conclusion
In summary, moments provide valuable information about a given dataset which can be used to better understand trends and patterns over time as well as identify outliers or other unusual features within it. Knowing what kind of moments exist—mean, standard deviation, skewness/kurtosis—and being able to calculate them properly will go a long way towards helping you analyze datasets accurately and with confidence! As such, learning about moments should be an essential component for any statistician who wants to become proficient at their craft!

Check out my latest book titled as First Principles Thinking: Building winning products using first principles thinking.
- Three Approaches to Creating AI Agents: Code Examples - June 27, 2025
- What is Embodied AI? Explained with Examples - May 11, 2025
- Retrieval Augmented Generation (RAG) & LLM: Examples - February 15, 2025
I found it very helpful. However the differences are not too understandable for me