Last updated: 21st Nov, 2023
Statistical hypothesis testing is an essential tool in inferential statistics that enables researchers to make informed decisions about the population parameters based on sample statistics. One common hypothesis test for comparing two sample means is the Two-Sample Z-Test.
In statistics, a two-sample z-test for means is used to determine if the means of two populations are equal. This test is used when the population standard deviations are known. As data scientists, it is of utmost importance to be able to understand and conduct this test accurately. In this blog, we will delve deeper into the Two-Sample Z-Test for means, exploring its formula, assumptions, and examples of how to apply it in real-world scenarios. Whether you are a student of statistics, a researcher in a scientific field, or a data analyst looking to build your statistical toolset, this blog will provide you with the foundation to understand and use the Two-Sample Z-Test for means.
What is a Two-Sample Z-test for Means?
Two-sample Z-test for means is a statistical hypothesis testing technique that compares two independent samples to determine whether the means of the populations that generated them are different or not. It relies on the assumption that the populations have normal distributions, known population variances or equal variances, and that the samples are randomly and independently drawn from the respective populations. This test is used when the standard deviations (σ) of the two populations are known. This test can be used when we have a sample from each population and we know the variance for these populations.
The Two-Sample Z-Test is used when the sample sizes are large (typically, n ≥ 30), and the population standard deviations are known or can be estimated from the sample data. When these assumptions are met, the sampling distribution of the sample means follows a normal distribution, and the Z-test statistic can be used to test the null hypothesis that there is no significant difference between the means of the two populations.
However, when the population standard deviations are unknown, or the sample sizes are small, the Two-Sample T-Test for independence samples is more appropriate. The T-test is a robust statistical test that can handle the situation of unknown population standard deviations or small sample sizes by estimating the standard deviation from the sample data and using a t-distribution instead of standard normal distribution. The T-test has a higher degree of freedom and is more accurate in estimating the population parameters than the Z-test.
Here are some of the real-world examples where a two-sample z-test for means can be used:
- Comparing the performance of students in two different classes
- Comparing the average salaries of men and women in a company
- Comparing the KPIs of two different teams
- Comparing the performance of employees in two different departments
- Comparing the average IQ scores of two groups of people
- Determining if there is a significant difference in the amount of rainfall between two cities
- Investigating whether the mean daily energy intake of men and women are different
Null & Alternate Hypothesis for Two-Sample Z-test for Means
The null hypothesis for the Two-Sample Z-Test for means is that there is no significant difference between the means of two independent populations. Mathematically, it can be expressed as:
H0: μ1 – μ2 = 0
Where μ1 and μ2 represent the population means of the two independent populations.
The alternative hypothesis, on the other hand, states that there is a significant difference between the means of the two populations. The alternative hypothesis can be one-tailed or two-tailed, depending on the research question and the directionality of the expected difference.
For a two-tailed test, the alternative hypothesis can be expressed as:
Ha: μ1 – μ2 ≠ 0
This indicates that we are interested in detecting any significant difference between the two population means, regardless of its direction.
For a one-tailed test, the alternative hypothesis can be expressed as:
Ha: μ1 – μ2 > 0 or Ha: μ1 – μ2 < 0
This indicates that we are interested in detecting a significant difference between the two population means in a specific direction, either positive or negative.
In both cases, we use the Two-Sample Z-Test to determine whether there is sufficient evidence to reject the null hypothesis and accept the alternative hypothesis.
Z-statistics Formula: Two-sample Z-test for means?
The following is the formula for z-statistics for two-sample z-test for means given the population standard deviation is known.
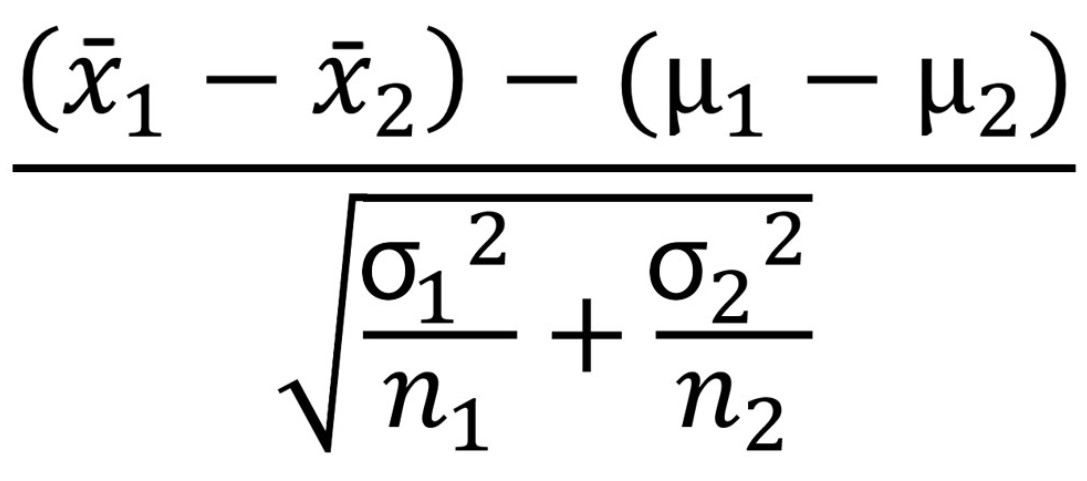
x̄1 is the mean of the first sample
x̄2 is the mean of the second sample
μ1 is the mean of the first population
μ2 is the mean of the second population
(μ1 – μ2) is hypothesized difference between the population means
σ1 is the standard deviation of the first population
σ2 is the standard deviation of the second population
n1 is the number of the data points in the first sample
n2 is the number of the data points in the second sample
Once the value of z-statistics is calculated, we can use this value to calculate the p-value, which indicates the probability of obtaining a z-value as extreme as the one calculated under the null hypothesis. The value of p-value is then compared to the significance level (α) to determine whether to reject or fail to reject the null hypothesis.
If the p-value is less than α, we reject the null hypothesis and conclude that there is a significant difference between the means of the two populations. If the p-value is greater than or equal to α, we fail to reject the null hypothesis and conclude that there is insufficient evidence to suggest that the means of the two populations are different.
Example: Two-sample Z-test for Means
A company wanted to compare the performance of its call center employees in two different centers located in two different parts of the country – Hyderabad, and Bengaluru, in terms of the number of tickets resolved in a day (hypothetically speaking). The company randomly selected 30 employees from the call center in Hyderabad and 30 employees from the call center in Bengaluru. The following data was collected:
Hyderabad: x̄1 = 750, σ1 = 20
Bengaluru: x̄2 = 780, σ2 = 25
The company wants to determine if the performance of the employees in Hyderabad is different from the performance of the employees in the Bengaluru center. To do this, we will use a two-sample z-test for means. We will perform two-tailed test.
First, we will formulate the null and alternate hypotheses and set the level of significance for the test.
H0: There is no difference between the performance of employees at different call centers.
H1: There is a difference in the performance of the employees.
The level of significance is set as 0.05.
Next, the mean and standard deviation for each sample will need to be determined.
Hyderabad: x̄1 = 750, σ1 = 20
Bengaluru: x̄2 = 780, σ2 = 25
Next, we will calculate the hypothesized difference between the two population means. In this case, the company is hypothesizing that the mean performance in Hyderabad is the same as that of Bengaluru. So, (μ1 – μ2 ) = 0
Finally, we will use the formula for two-sample z-test for means to calculate the test statistic.
z= (x̄1 – x̄2 ) / √((σ1 )²/n1 + (σ2)²/n2)
z = (-30) / √((20)²/30 + (25)²/30))
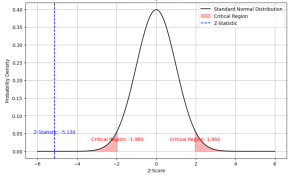
z = -5.13
At a significance level of 0.05, the p-value is less than 0.00001. You can calculate the same by using P-value from Z-score calculator. As the p-value is lot less than the critical value of 0.05, the result is statistically significant and hence you can reject the null hypothesis. Hence, the performance of Hyderabad’s team is considered to be not equal to the performance of Bengaluru’s team.
The following plot also demonstrates how the Z-statistics fall beyond the critical region given the two-tailed test performed. From the plot, you can understand that null hypothesis is rejected because Z-statistics is less than the critical region on the negative side of the plot.

Two Sample Z-test for Means: Python Example
The following Python code can be used for two samples Z-test for means.
def ztest_ind(X1, X2, mudiff, std_dev_1, std_dev_2, n1, n2):
    from numpy import sqrt, abs, round
    from scipy.stats import norm
    pooled_SE = sqrt(std_dev_1**2/n1 + std_dev_2**2/n2)
    z = ((X1 - X2) - mudiff)/pooled_SE
    pval = 2*(norm.sf(abs(z)))
    return round(z, 3), round(pval, 4)
The above method can be used to calculate z-statistics and p-value as like the following:
z_statistics, p_value = ztest_ind(750, 780, 0, 20, 25, 30, 30)
print("Z-statistics: ", z_statistics)
print("P-value: ", p_value)
Two-sample Z-Test for Means & Data-Driven Decision Making
The Two-Sample Z-Test for means can be applied in various real-life scenarios related to decision making. For example, a company may want to test whether a new marketing strategy has a significant impact on sales by comparing the mean sales before and after the implementation of the strategy.
Suppose a clothing store introduced a new marketing strategy to increase sales by sending discount coupons to customers via email. To evaluate the effectiveness of the new strategy, the store can use the Two-Sample Z-Test for means to compare the average sales of a randomly selected group of customers who received the discount coupons to the sales of another randomly selected group of customers who did not receive any coupons.
The null hypothesis would be that there is no significant difference between the mean sales of the two groups, while the alternative hypothesis would be that there is a significant difference in the mean sales of the two groups. The significance level (α) would be set to 0.05.
After collecting the data and calculating the test statistic, if the p-value is less than 0.05, the company can reject the null hypothesis and conclude that the new marketing strategy has a significant impact on sales. This would enable the company to make an informed decision on whether to continue or modify the marketing strategy.
Overall, the Two-Sample Z-Test for means can be a useful tool for decision making in various real-life scenarios, enabling individuals and organizations to make data-driven decisions with confidence.
You may wonder whether we could also have used two-sample T-test for means? Well, the two-sample Z-Test for means is appropriate when the sample size is large (typically, n ≥ 30) and the population standard deviation is known or can be estimated from the sample data. In the example of the clothing store, it is possible that the population standard deviation of sales is known or can be estimated accurately from the available data. In such a case, the two-sample z-test would be more appropriate than the two-sample z-test because it has higher statistical power and can provide more accurate results.
However, if the population standard deviation is unknown or cannot be estimated accurately from the available data, the two-sample t-test would be more appropriate. Additionally, if the sample size is small (typically, n < 30), the t-test is preferred over the z-test because the normal distribution assumption of the z-test may not hold for small sample sizes.
Performing Two-Sample Z-Test for Means using Excel
In this section, we will learn step-by-step method of how to perform two-sample Z-test for means using an excel spreadsheet. Taking example discussed earlier in this blog, let’s say you have 50 data samples for both Hyderabad and Bengaluru call centers. The following steps would need to be followed:
- Input the Data:
- Open Excel and create two columns: one for Hyderabad and one for Bengaluru.
- Enter the generated data for each group in their respective columns.
- Calculate Sample Means and Standard Deviations:
- For the Hyderabad data (assume it’s in cells A2:A51):
- Mean: = AVERAGE(A2:A51)
- Standard Deviation: =STDEV.S(A2:A51)
- For the Bengaluru data (assume it’s in cells B2:B51):
- Mean: = AVERAGE(B2:B51)
- Standard Deviation: = STDEV.S(B2:B51)
- For the Hyderabad data (assume it’s in cells A2:A51):
- Calculate the Z-Statistic:
- In a new cell, input the formula for the Z-statistic:
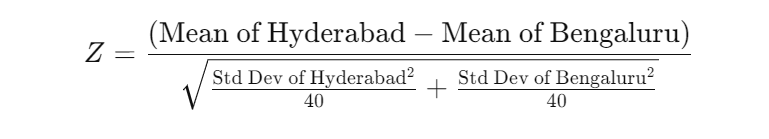
- Use cell references for the means and standard deviations you calculated.
- In a new cell, input the formula for the Z-statistic:
- Find the P-Value:
- Use Excel’s NORM.S.DIST function to find the two-tailed p-value
2∗(1−NORM.S.DIST(ABS(Z),TRUE)) - This will give you the probability of observing a Z-statistic as extreme as the one calculated, assuming the null hypothesis is true.
- Use Excel’s NORM.S.DIST function to find the two-tailed p-value
- Interpret the Results:
- Choose a significance level (commonly 0.05).
- If the p-value is less than the significance level, reject the null hypothesis, indicating a significant difference in performance between the two centers.
- If the p-value is greater than the significance level, you do not have sufficient evidence to reject the null hypothesis, suggesting no significant difference in performance.
Conclusion
When two samples are taken from two populations, the two-sample z-test for means is used to determine whether or not there is a significant difference between the two means. The null hypothesis states that there isn’t any statistical significance between the two population means (H0) and the alternate hypothesis says otherwise (H1). In order to perform the hypothesis testing to determine whether the difference exists between the two groups or samples and that the difference is statistically significant, the two-samples Z-test for means is used.

Check out my latest book titled as First Principles Thinking: Building winning products using first principles thinking.
- Mathematics Topics for Machine Learning Beginners - July 6, 2025
- Questions to Ask When Thinking Like a Product Leader - July 3, 2025
- Three Approaches to Creating AI Agents: Code Examples - June 27, 2025
Hello sir,
In this case why is standard error not considered as pooled one i.e sqrt((n1*σ^2 + n2*σ^2)/(n1 + n2 – 2))