Category Archives: Data Science
Micro-average, Macro-average, Weighting: Precision, Recall, F1-Score
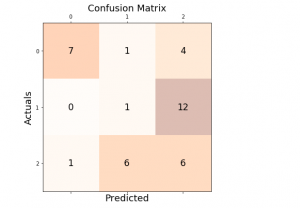
Last updated: 30th Dec, 2023 In this post, you will learn about how to use micro-averaging and macro-averaging methods for evaluating scoring metrics (precision, recall, f1-score) for multi-class classification machine learning problem. You will also learn about weighting method used as one of the other averaging choices of metrics such as precision, recall and f1-score for multi-class classification problem. The concepts will be explained with Python code examples. What & Why of Micro, Macro-averaging and Weighting metrics? Micro and macro-averaging methods are used in the evaluation of classification models, to compute performance metrics like precision, recall, and F1-score. These methods are especially relevant in scenarios involving multi-class or multi-label classification. In case of multi-class classification, …
Mean Squared Error or R-Squared – Which one to use?
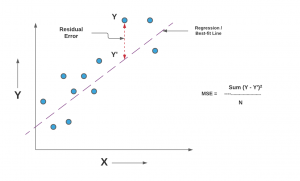
Last updated: 29th Dec, 2023 As you embark on your journey to understand and evaluate the performance of regression models, it’s crucial to know when to use each of these metrics and what they reveal about your model’s accuracy. In this post, you will learn about the concepts of the mean-squared error (MSE) and R-squared (R2), the difference between them, and which one to use when evaluating the linear regression models. Note that MSE is very closely related to root mean squared error (RMSE) which is also discussed in this blog. You also learn Python examples to understand the concepts in a better manner. For learning the differences between other …
Data Science Competitions on Different Online Platforms

Data science / Machine Learning is an ever-evolving field, and competitions provide a great way for beginners / practitioners to hone their skills, solve real-world problems, enhance their resumes / CVs and even earn rewards. Here’s a roundup of some notable machine learning / data science / AI competition platforms, each offering unique opportunities. Each of these data science competition platforms offers unique opportunities and challenges, making them ideal for both beginners and expert data scientists at various stages of their careers to learn, compete, and contribute to a wide array of problems.
Independent Samples T-test: Formula, Examples, Calculator
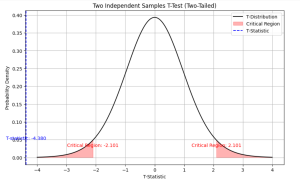
Last updated: 21st Dec, 2023 As a data scientist, you may often come across scenarios where you need to compare the means of two independent samples. In such cases, a two independent samples t-test, also known as unpaired two samples t-test, is an essential statistical tool that can help you draw meaningful conclusions from your data. This test allows you to determine whether the difference between the means of two independent samples is statistically significant or due to chance. In this blog, we will cover the concept of independent samples t-test, its formula, real-world examples of its applications and the Python & Excel example (using scipy.stats.ttest_ind function). We will begin …
Introducing Our New Data Science & AI Trends Page

We are thrilled to announce the launch of our dedicated Data Science and AI Trends page at VitalFlux.com! This new resource is designed to be a one-stop hub for data scientists, AI enthusiasts, and anyone passionate about staying at the forefront of technological innovation. What You’ll Find Our Data Science & AI Trends page is more than just a collection of articles; it’s a dynamic resource that aggregates the most insightful and current information from various high-impact sources. Here’s a sneak peek at what you can expect: Web Pages Stay informed with our selection of web pages from leading research institutions, tech news outlets, and individual thought leaders in the …
Z-test vs T-test: Formula, Examples
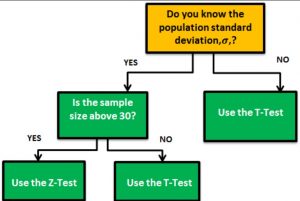
Last updated: 18th Dec, 2023 When it comes to statistical tests, z-test and t-test are two of the most commonly used. But what is the difference between z-test and t-test? And when to use z-test vs t-test? In this relation, we also wonder about z-statistics vs t-statistics. And, the question arises around what’s the difference between z-statistics and t-statistics. In this blog post, we will answer all these questions and more! We will start by explaining the difference between z-test and t-test in terms of their formulas. Then we will go over some examples so that you can see how each test is used in practice. As data scientists, it …
Python – Replace Missing Values with Mean, Median & Mode
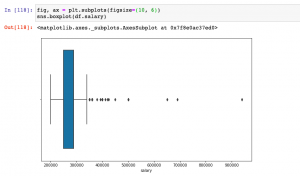
Last updated: 18th Dec, 2023 Have you found yourself asking question such as how to deal with missing values in data analysis stage? When working with Python, have you been troubled with question such as how to replace missing values in Pandas data frame? Well, missing values are common in dealing with real-world problems when the data is aggregated over long time stretches from disparate sources, and reliable machine learning modeling demands for careful handling of missing data. One strategy is imputing the missing values, and a wide variety of algorithms exist spanning simple interpolation (mean, median, mode), matrix factorization methods like SVD, statistical models like Kalman filters, and deep …
Standard Deviation of Population vs Sample
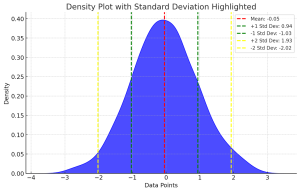
Last updated: 18th Dec, 2023 Have you ever wondered what the difference between standard deviation of population and a sample? Or why and when it’s important to measure the standard deviation of both? In this blog post, we will explore what standard deviation is, the differences between the standard deviation of population and samples, and how to calculate their values using their formula and Python code example. By the end of this post, you should have a better understanding of standard deviation in general and why it’s important to calculate it for both populations and samples. Check out my related post – coefficient of variation vs standard deviation. What is …
Tool – Machine Learning Algorithm Cheat Sheet

Here is a comprehensive and user-friendly tool designed to bridge the gap between complex machine learning concepts and practical understanding. Whether you’re a student, educator, data scientist, or just a curious learner, this tool is your go-to resource for quick insights into some of the most popular and widely used machine learning algorithms. From Linear Regression to more advanced techniques like XGBoost and Principal Component Analysis, the plugin offers a succinct summary of each algorithm, including its definition, typical use cases, and applicable Python and R libraries. Select a Machine Learning Algorithm Select a machine learning algorithm from the drop-down to view and learn the details. Select a Feature Scaling …
One-Sample T-Test Calculator

Here are two different methods of calculating t-statistics for one-sample t-test. In method 1, you enter the dataset. In method 2, you provide the sample mean, sample standard deviation and sample size. Here are the common set of inputs. One of the input field is the hypothesized mean, which is the population mean you expect or hypothesizes before conducting the test. This value is crucial for comparison against the sample mean. By default, it is set to 0, but you can modify it based on their hypothesis. The significance level, another critical input, is pre-set at 0.05 but can be adjusted. This level determines the threshold for statistical significance. In …
One Sample T-test: Formula & Examples
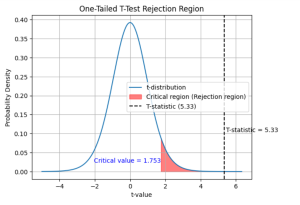
Last updated: 16th Dec, 2023 In statistics, the t-test is often used in research when the researcher wants to know if there is a significant difference between the mean of sample and the population, or whether there is a significant difference between the means of two groups (unpaired / independent or paired). There are three types of t-tests: the one sample t-test, two samples or independent samples t-test, and paired samples t-test. In this blog post, we will focus on the one sample t-test and explain with formula and examples. As data scientists, it is important for us to understand the concepts of t-test and how to use it in …
Linear Regression vs. Polynomial Regression: Python Examples
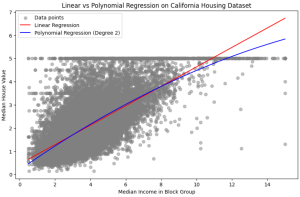
In the realm of predictive modeling and data science, regression analysis stands as a cornerstone technique. It’s essential for understanding relationships in data, forecasting trends, and making informed decisions. This guide delves into the nuances of Linear Regression and Polynomial Regression, two fundamental approaches, highlighting their practical applications with Python examples. What are Linear and Polynomial Regression? In this section, we will learn about what are linear and polynomial regression. What is Linear Regression? Linear Regression is a statistical method used in predictive analysis. It’s a straightforward approach for modeling the relationship between a dependent variable (often denoted as y) and one or more independent variables (denoted as x). In …
Linear Regression vs Logistic Regression: Python Examples
Last updated: 15th Dec, 2023 In the ever-evolving landscape of machine learning, two regression algorithms stand out for their simplicity and effectiveness: Linear Regression and Logistic Regression. But what exactly are these algorithms, and how do they differ from each other? At first glance, logistic regression and linear regression might seem very similar – after all, they share the word “regression.” However, the devil, as they say, is in the details. Each method is uniquely tailored to solve specific types of problems, and understanding these subtleties is key to unlocking their full potential. Linear regression and logistic regression are both machine learning algorithms used for modeling relationships between variables but …
Linear Regression in Machine Learning: Python Examples
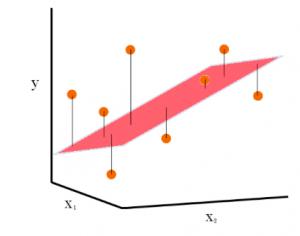
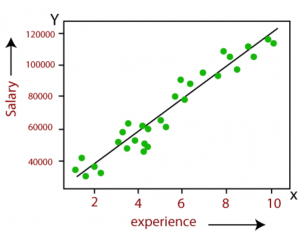
Last updated: 15th Dec, 2023 In this post, the linear regression concepts in machine learning is explained with multiple real-life examples. Two types of regression models (simple/univariate and multiple/multivariate linear regression) are taken up for sighting examples. In addition, Python code examples are used for demonstrating training of simple linear and multiple linear regression models. In case you are a machine learning or data science beginner, you may find this post helpful enough. You may also want to check a detailed post – What is Machine Learning? Concepts & Examples. What is Linear Regression? Linear regression is a machine learning concept that is used to build or train the models …
Random Forest vs XGBoost: Which One to Use? Examples

Understanding the differences between XGBoost and Random Forest machine learning algorithm is crucial as it guides the selection of the most appropriate model for a given problem. Random Forest, with its simplicity and parallel computation, is ideal for quick model development and when dealing with large datasets, whereas XGBoost, with its sequential tree building and regularization, excels in achieving higher accuracy, especially in scenarios where overfitting is a concern. This knowledge can be helpful to balance between computational efficiency and predictive performance, tailor models to specific data characteristics, and optimize their approach for either rapid prototyping or precision-focused tasks. In this blog, we will learn the difference between Random Forest …
How to Add Rows & Columns to Pandas Dataframe
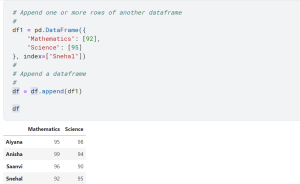
Last updated: 12th Dec, 2023 Pandas is a popular data manipulation library in Python, widely used for data analysis and data science tasks. Pandas Dataframe is a two-dimensional labeled data structure with columns of potentially different types, similar to a spreadsheet or SQL table. One of the common tasks in data manipulation when working with Pandas package in Python is how to add new columns and rows to an existing and empty dataframe. It might seem like a trivial task, but choosing the right method to add a row to a dataframe as well as adding a column can significantly impact the performance and efficiency of your code. In this …
I found it very helpful. However the differences are not too understandable for me