Category Archives: Data Science
Sign Test Hypothesis: Python Examples, Concepts
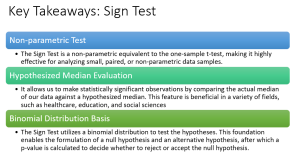
Have you ever wanted to make an informed decision, but all you have is a small amount of non-parametric data? In the realm of statistics, we have various tools that enable us to extract valuable insights from such datasets. One of these handy tools is the Sign test, a beautifully simple yet potent method for hypothesis testing. Sign test is a non-parametric test which is often seen as a cousin to the one-sample t-test, allows us to infer information about a whole population based on a small, paired sample. It is particularly useful when dealing with dichotomous data – Data that can have only two possible outcomes. In this blog …
K-Means Clustering Concepts & Python Example
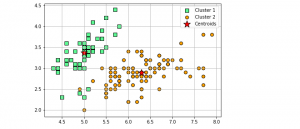
Clustering is a popular unsupervised machine learning technique used in data analysis to group similar data points together. The K-Means clustering algorithm is one of the most commonly used clustering algorithms due to its simplicity, efficiency, and effectiveness on a wide range of datasets. In K-Means clustering, the goal is to divide a given dataset into K clusters, where each data point belongs to the cluster with the nearest mean value. The algorithm works by iteratively updating the cluster centroids until convergence is achieved. In this post, you will learn about K-Means clustering concepts with the help of fitting a K-Means model using Python Sklearn KMeans clustering implementation. You will …
Mann-Whitney U Test (Wilcoxon Rank Sum): Python Example
In the ever-evolving world of data science, extracting meaningful insights from diverse data sets is a fundamental task. However, a significant problem arises when these data sets do not conform to the assumptions of normality and equal variances, rendering popular parametric tests like the t-test ineffectual. Real-world data often tends to be skewed, includes outliers, or originates from an unknown distribution. For instance, data related to salaries, house prices, or user behavior metrics often challenge traditional statistical methods. This is where the Wilcoxon Rank Sum Test, also known as the Mann-Whitney U test, proves to be an invaluable statistical test. As a non-parametric alternative to the independent two-sample t-test, it …
Dashboard Design Best Practices: Examples
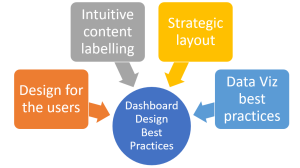
Are you looking to create effective, user-centric, and highly actionable data dashboards? Do you want your dashboard to not just present data, but tell a story that compels your team to make informed decisions? In an age of data-driven decision making, dashboards have become an indispensable tool for product managers, data analysts, and data visualization experts alike. A well-designed dashboard provides a real-time visual snapshot of performance, highlights crucial metrics, and assists in spotting trends or anomalies. However, designing a good dashboard is both an art and a science. It demands a deep understanding of users’ needs, a strategic approach to information organization, and an adept use of data visualization …
Data Science & Big Data Career Paths
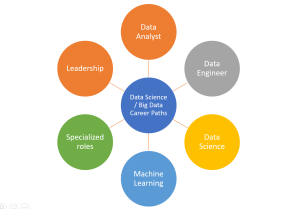
Navigating the world of data science can be as complex as the data sets that these professionals work with. As the field continues to evolve at a rapid pace, the array of job roles and career paths have expanded, encompassing a multitude of specializations ranging from Data Analysts and Machine Learning Engineers to Data Scientists. This dynamic landscape offers a wealth of opportunities, but it can also create confusion for those looking to embark on or advance their careers in data science. In this blog, we aim to demystify these career paths in data science, offering clarity on the progression of roles, responsibilities, and skills needed for each. Whether you …
Types of Data Visualization: Charts, Plots Examples
In today’s data-driven world, the ability to extract insights from vast amounts of information has become a critical skill for data scientists and analysts. Visualizing data through charts, graphs, and other types of visual representations can help them uncover patterns and relationships that might be difficult to spot otherwise. However, not all visualizations are created equal, and choosing the right type of visualization can make all the difference in communicating insights effectively. That’s why understanding the different types of visualization available is crucial for data visualization experts and data scientists. In this blog, we’ll explore some of the most common types of visualization, including comparison plots, relation plots, composition plots …
Machine Learning Use Cases in Finance: Concepts & Examples

What if we can build solutions that could predict financial market trends, assess credit risk with unerring precision, detect fraudulent activities before they occur, and significantly automate your day-to-day operations? Such solutions can be called as predictive analytics solutions which leverages AI / machine learning for making predictions. Machine learning has found its way into finance and is being used in various ways to improve the industry. Finance has always been a data-driven industry, and in recent years, machine learning has become an increasingly important tool for making sense of that data. In this blog post, we will explore some of these use cases and explain how machine learning is …
Kruskal Wallis H Test Formula, Python Example
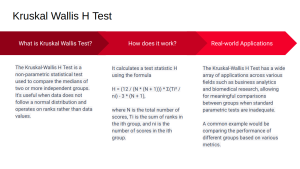
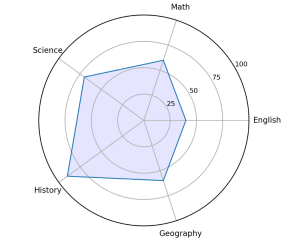
Ever wondered how to find out if different groups of people have different preferences? Maybe you’re a marketer trying to understand if different age groups prefer different features in a smartphone. Or perhaps you’re a public policy researcher, trying to determine if different neighborhoods are equally satisfied with their local services. How do you go about answering these questions, especially when the data doesn’t follow the typical bell-shaped curve or normal distribution? The solution lies in the Kruskal-Wallis H Test! This is a non-parametric test that helps to compare more than two independent groups and it comes in really handy when the data is not bell-shaped curve data or not …
Weighted Regression Model Python Examples
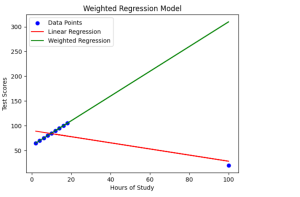
Have you ever wondered how regression models can be enhanced to provide more accurate predictions, even in the presence of outliers or data points with varying significance? Enter weighted regression machine learning models, an approach that assigns weights to data points, allowing for precise adjustments and improvements in prediction accuracy. In this blog post, we will learn about the concepts of weighted regression models with the help of examples while demonstrating with the help of Python implementation. Traditional linear regression is a widely-used technique, but it may struggle when faced with outliers or situations where some data points carry more weight than others. However, weighted regression models help overcome these …
Clinical Trials & Statistics Use Cases: Examples

Are you a statistician, data scientist or business analyst working in the field of clinical trials? Do you find yourself curious about how statistical analyses play a pivotal role in unlocking valuable actionable insights and driving critical decisions in drug development? If so, in this blog, we will learn about various different use cases where clinical trials and statistics intersect. Clinical trials are the backbone of evidence-based medicine, paving the way for the discovery and development of innovative therapies that can improve patient outcomes. Within this realm, statistics allows researchers and analysts to make sense of complex data, evaluate treatment efficacy, assess safety profiles, and optimize trial design. In this …
Spearman Correlation Coefficient: Formula, Examples
Have you ever wondered how you might determine the relationship between two sets of data that aren’t necessarily linear, or perhaps don’t adhere to the assumptions of other correlation measures? Enter the Spearman Rank Correlation Coefficient, a non-parametric statistic that offers robust insights into the monotonic relationship between two variables – perfect for dealing with ranked variables or exploring potential relationships in a new, exploratory dataset. In this blog post, we will learn the concepts of Spearman correlation coefficient with the help of Python code examples. Understanding the concept can prove to be very helpful for data scientists. Whether you’re exploring associations in marketing data, results from a customer satisfaction …
Heteroskedasticity in Regression Models: Examples
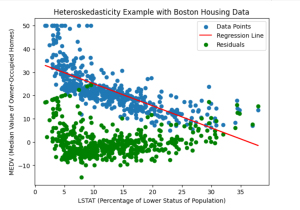
Have you ever encountered data that exhibits varying patterns of dispersion and wondered how it might impact your regression models? The varying patterns of dispersion represents the essence of heteroskedasticity – the phenomenon where the spread or variability of the residuals / errors in a regression model changes across different levels or values of the independent variables. As data scientists, understanding the concept of heteroskedasticity is crucial for robust and accurate analyses. In this blog, we delve into the intriguing world of heteroskedasticity in regression models and explore its implications through real-world examples. What’s heteroskedasticity and why learn this concept? Heteroskedasticity refers to a statistical phenomenon observed in regression analysis, …
Credit Risk Modeling & Machine Learning Use Cases

Have you ever wondered how banks and financial institutions decide who to lend money to, or how much to lend? The secret lies in credit risk modeling, a sophisticated approach that evaluates the likelihood of a borrower defaulting on their loan. Through in-depth analysis of historical data and borrower’s credit behavior, these models play a pivotal role in guiding lending decisions, managing risks, and ultimately, driving profitability. In the face of growing financial complexities, traditional methods are often insufficient. That’s where machine learning comes into play that helps better anticipate credit risk. By automating the identification of patterns within data, patterns that often go unnoticed by human analysis, machine learning …
Matplotlib Bar Chart Python / Pandas Examples
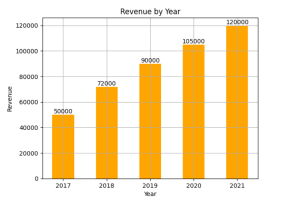
Are you looking to learn how to create bar charts / bar plots / bar graph using the combination of Matplotlib and Pandas in Python? Bar charts are one of the most commonly used visualizations in data analysis, enabling us to present categorical data in a visually appealing and intuitive manner. Whether you’re a beginner data scientist or an intermediate-level practitioner seeking to enhance your visualization skills, this blog will provide you with practical examples and hands-on guidance to create compelling bar charts / bar plots using Matplotlib libraries in Python. You will also learn how to leverage the data manipulation capabilities of Pandas to prepare the data for visualization, …
One-hot Encoding Concepts & Python Examples
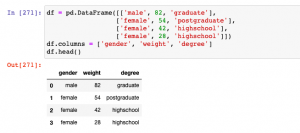
Have you ever encountered categorical variables in your data analysis or machine learning projects? These variables represent discrete qualities or characteristics, such as colors, genders, or types of products. While numerical variables can be directly used as inputs for machine learning algorithms, categorical variables require a different approach. One common technique used to convert categorical variables into a numerical representation is called one-hot encoding, also known as dummy encoding. When working with machine learning algorithms, categorical variables need to be transformed into a numerical representation to be effectively used as inputs. This is where one-hot encoding comes to rescue. In this post, you will learn about One-hot Encoding concepts and …
Ridge Regression Concepts & Python example
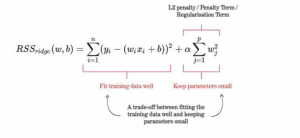
Ridge regression is a type of linear regression that penalizes ridge coefficients. This technique can be used to reduce the effects of multicollinearity in ridge regression, which may result from high correlations among predictors or between predictors and independent variables. In this tutorial, we will explain ridge regression with a Python example. What is Ridge Regression? Ridge regression is a powerful technique in machine learning that addresses the issue of overfitting in linear models. In linear regression, we aim to model the relationship between a response variable and one or more predictor variables. However, when there are multiple variables that are highly correlated, the model can become too complex and …
I found it very helpful. However the differences are not too understandable for me