Tag Archives: Data Science
Mathematics Topics for Machine Learning Beginners
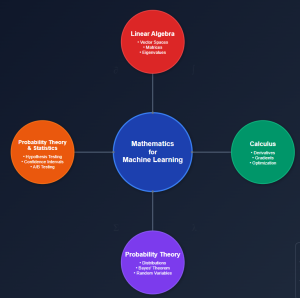
In this blog, you would get to know the essential mathematical topics you need to cover to become good at AI & machine learning. These topics are grouped under four core areas including linear algebra, calculus, multivariate calculus and probability theory & statistics. Linear Algebra Linear algebra is arguably the most important mathematical foundation for machine learning. At its core, machine learning is about manipulating large datasets, and linear algebra provides the tools to do this efficiently. Vector Spaces and Operations Matrices: Your Data’s Best Friend Eigenvalues and Eigenvectors Matrix Decompositions Calculus Machine learning is fundamentally about optimization – finding the best parameters that minimize error in the loss function. …
Understanding FAR, FRR, and EER in Auth Systems

Have you ever wondered how systems determine whether to grant or deny access, and how they balance the risk of false acceptance with usability? This tutorial explores the fundamental concepts behind evaluating authentication systems or classification models using False Acceptance Rate (FAR), False Rejection Rate (FRR), and Equal Error Rate (EER). These metrics are essential for assessing the balance between usability and security in auth systems. Gaining a good understanding of these terms can greatly enhance both theoretical insights and practical application in designing reliable machine learning systems. What is False Acceptance Rate (FAR)? The False Acceptance Rate measures how frequently a system incorrectly grants access to an unauthorized individual. …
Confounder Features & Machine Learning Models: Examples

In machine learning, confounder features or variables can significantly affect the accuracy and validity of your model. A confounder feature is a variable that influences both the predictor and the outcome or response variables, creating a false impression of causality or correlation. This makes it harder to determine whether the observed relationship between two variables is genuine or merely due to some external factor. Example of Confounder Features For instance, consider a model that predicts a person’s likelihood of heart disease based on their diet. You may conclude that people eating a balanced diet are less likely to have heart disease, but this relationship could be confounded by exercise habits. …
Credit Card Fraud Detection & Machine Learning

Last updated: 26 Sept, 2024 Credit card fraud detection is a major concern for credit card companies. With credit cards so prevalent in our society, credit card companies must be able to prevent fraud happening with credit card transactions and protect their customers. Machine learning techniques can provide a powerful and effective way of detecting fraud happening with transactions done using credit cards. In this blog post we will discuss ML techniques that data scientists can use to design appropriate fraud detection solutions including algorithms such as Bayesian networks, support vector machines, neural networks and decision trees. What are different types of credit card fraud? The following are different types …
Principal Component Analysis (PCA) & Feature Extraction – Examples

Last updated: 17 Sept, 2024 Principal component analysis (PCA)is a dimensionality reduction technique that reduces the number of dimensions or features in a dataset without sacrificing a lot of information. What if it is told that you could take a dataset with 500 columns, use PCA to reduce it to 50 columns, and still able to retain 90% or more of the information in the original dataset? Wouldn’t that sound like a miracle? In this post, you will learn about how to use PCA for extracting important features (also termed as feature extraction technique) from a list of given features. As a machine learning / data scientist, it is very …
Content-based Recommender System: Python Example

In this blog, we will learn about how to implement content-based recommender system using Python programming example. We will learn with the example of movie recommender system for recommending movies. Download the movies data from here to work with example given in this blog. The following is a list of key activities we would do to build a movie recommender system based on content-based recommendation technique. Data loading & preparation Text vectorization Cosine similarity computation Getting recommendations Data Loading & Preparation To start with, we import the data in csv format. Once data is imported, next step is analyse and prepare data before we apply modeling techniques. The dataset contains …
Recommender Systems in Machine Learning: Examples

Last updated: 16th Sep, 2024 Recommender systems are widely used in applications such as personalized content recommendation (e.g., movies, books, music), online shopping, and social media. One common example of a recommender system is Netflix. Netflix uses a sophisticated recommender system to suggest movies and TV shows that a user may want to watch. The recommendation algorithm takes into account past user behavior, such as ratings, viewing history, and interactions with content (e.g., likes, watch time). Recommender systems typically leverage techniques such as collaborative filtering, content-based filtering, or hybrid methods that combine both approaches. These systems analyze patterns in user behavior, item attributes, and sometimes additional context, such as demographics …
Difference: Binary vs Multiclass vs Multilabel Classification

Last updated: 13th Sep, 2024 There are three main types of classification algorithms when dealing with machine learning classification problems: Binary, Multiclass, and Multilabel. In this blog post, we will discuss the differences between them and how they can be used to solve different classification problems. Binary classifiers can only classify data into two categories, while multiclass classifiers can classify data into more than two categories. Multilabel classifiers assign or tag the data to zero or more categories. Let’s take a closer look at each type! Binary classification & examples Binary classification is used to represent classification technique in supervised machine learning in which data is classified into two mutually …
Sklearn LabelEncoder Example – Single & Multiple Columns

Last updated: 13 Sept, 2024 In this post, you will learn about the concept of encoding such as Label Encoding used for encoding categorical features while training machine learning models. Label encoding technique is implemented using sklearn LabelEncoder. You would learn the concept and usage of sklearn LabelEncoder using code examples, for handling encoding labels related to categorical features of single and multiple columns in Python Pandas Dataframe. The following are some of the points which will get covered: Background When working with dataset having categorical features, you come across two different types of features such as the following. Many machine learning algorithms require the categorical data (labels) to be …
ROC Curve & AUC Explained with Python Examples
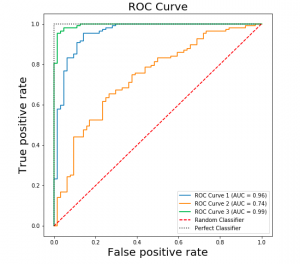
Last updated: 8th Sep, 2024 Confusion among data scientists regarding whether to use ROC Curve / AUC, or, Accuracy / precision / recall metrics for evaluating classification models often stems from misunderstanding ROC Curve / AUC concepts. The ROC Curve visualizes true positive vs false positive rates at various thresholds, while AUC quantifies the overall ability of a model to discriminate between classes, with higher values indicating better performance. In this post, you will learn about ROC Curve and AUC concepts along with related concepts such as True positive and false positive rate with the help of Python examples. It is very important to learn ROC, AUC and related concepts as it …
Accuracy, Precision, Recall & F1-Score – Python Examples
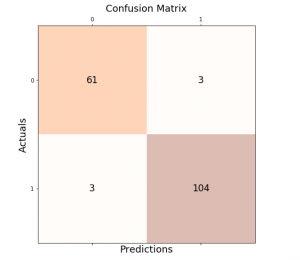
Last updated: 27th Aug, 2024 Classification models are used in classification problems to predict the target class of the data sample. The classification machine learning models predicts the probability that each instance belongs to one class or another. It is important to evaluate the model performance in order to reliably use these models in production for solving real-world problems. The model performance metrics include accuracy, precision, recall, and F1-score. In this blog post, we will explore these classification model performance metrics such as accuracy, precision, recall, and F1-score through Python Sklearn example. As a data scientist, you must get a good understanding of concepts related to the above in relation to …
Logistic Regression in Machine Learning: Python Example
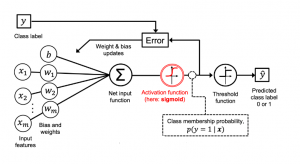
Last updated: 26th August, 2024 In this blog post, we will discuss the concepts of logistic regression machine learning algorithm with the help of python example. Logistic regression is a parametric algorithm which is used to estimate the probability of an event occurring. For example, it can be used in the medical field to predict the probability of a patient developing a certain disease based on various health indicators, such as age, weight, and blood pressure. It is often used in machine learning applications. What is Logistic Regression? Logistic regression is a type of supervised learning classification algorithm that is adept not only in binary classification but also in multinomial …
Reducing Overfitting vs Models Complexity: Machine Learning
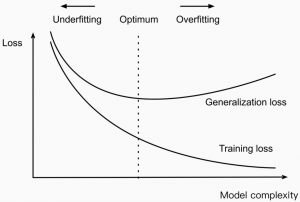
Last updated: 25th August, 2024 In machine learning, model complexity and overfitting are related in that the model overfitting is a problem that can occur when a model is too complex for different reasons. This can cause the model to fit the noise & outliers in the data rather than the underlying pattern. As a result, the model will perform poorly when applied to new and unseen data. In this blog post, we will discuss model complexity and how you can avoid overfitting in your models by handling the complexity. As data scientists, it is of utmost importance to understand the concepts related to model complexity and how it impacts …
Overfitting & Underfitting in Machine Learning
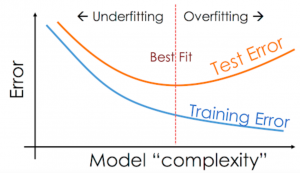
Last updated: 24th August, 2024 The performance of the machine learning models on unseen datasets depends upon two key concepts called underfitting and overfitting. In this post, you will learn about these concepts and more. In addition, you will also get a chance to test your understanding by attempting the quiz. The quiz will help you prepare well for data scientist interviews. Introduction to Overfitting & Underfitting Assuming an independent and identically distributed (I.I.d) dataset, when the prediction error on both the training and validation dataset is high, and the difference between them is very minimal, the model is said to have underfitted. In this scenario, it becomes cumbersome to …
Self-Supervised Learning: Concepts, Examples

Last updated: 20th August, 2024 Self-supervised learning is an approach to training machine learning models primarily for large corpus of unlabeled dataset. It has gained significant traction due to its effectiveness in various applications related to text and image. Self-supervised learning differs from supervised learning, where models are trained using labeled data, and unsupervised learning, where models are trained using unlabeled data without any pre-defined objectives. Instead, self-supervised learning defines pretext tasks as training models to extract useful features from the data that can be later fine-tuned for specific downstream tasks. The potential of self-supervised learning has already been demonstrated in many real-world applications, such as image classification, natural language …
MSE vs RMSE vs MAE vs MAPE vs R-Squared: When to Use?

Last updated: 18th August, 2024 As data scientists, we navigate a sea of metrics to evaluate the performance of our regression models. Understanding these metrics – Mean Squared Error (MSE), Root Mean Squared Error (RMSE), Mean Absolute Error (MAE), Mean Absolute Percentage Error (MAPE), and R-Squared – is crucial for robust model evaluation and selection. In this blog, we delve into the intricacies of these different metrics while learning them based on clear definitions, formulas, and guidance on when to use which of these metrics. Different Types of Regression Models Evaluation Metrics The following are different types of regression model evaluation metrics including MSE, RMSE, MAE, MAPE, R-squared, and Adjusted …
I found it very helpful. However the differences are not too understandable for me