Category Archives: Data Science
Generative AI Examples, Use Cases, Applications
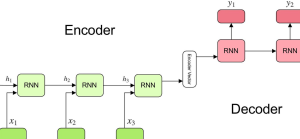
Last updated: 12th Dec, 2023 Machine learning, particularly in the field of Generative AI or generative modeling, has seen significant advancements recently. Generative AI involves algorithms that create new data samples and is widely recognized for its ability to produce not only coherent text but also highly realistic images, videos, and music. One of the most popular Generative AI example applications includes Large Language Models (LLMs) like GPT-3 and GPT-4, which are specialized in tasks like text generation, summarization, and machine translation. This technology has gained immense popularity due to its diverse applications and the impressive realism of the content it generates. As a data scientist, it is crucial to …
Difference Between Decision Tree and Random Forest

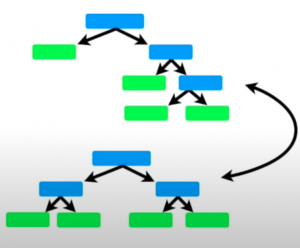
Last updated: 11th Dec, 2023 In machine learning, there are a few different tree-based algorithms that can be used for both regression and classification tasks. Two of the most popular are decision trees and random forest. A decision tree is a basic machine learning model, resembling a flowchart. Random Forest, an advanced technique, combines multiple decision trees to enhance accuracy and reduce overfitting, using averaging or voting for final predictions. Essentially, Random Forest is a collection of decision trees working together. Both of these algorithms have their similarities and differences, and in this blog post, we’ll take a look at the key differences between them. What’s Decision Tree Algorithm? How …
F-test & F-statistics in Linear Regression: Formula, Examples
Last updated: 11th Dec, 2023 In this blog post, we will take a look at the concepts and formula of f-test and related f-statistics in linear regression models and understand how to perform f-test and interpret f-statistics in linear regression with the help of examples. F-test and related F-statistics interpretation is key if you want to assess if the linear regression model results in a statistically significant fit to the data overall. An insignificant F-test determined by the f-statistics value vis-a-vis critical region implies that the predictors have no linear relationship with the target variable. We will start by discussing the importance of F-test and f-statistics in linear regression models …
Plot Decision Boundary in Logistic Regression: Python Example
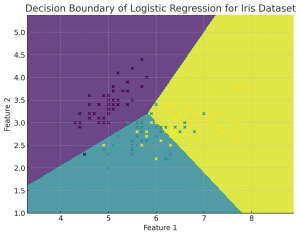
Plotting the decision boundary is a valuable tool for understanding, debugging, and improving machine learning classification models, especially for Logistic Regression. Plotting the decision boundary provides a visual assessment of model complexity, fit, and class separation capability. It enables identifying overfitting and underfitting based on gaps between boundary and data. Comparing decision boundary plots of different models allows direct visual evaluation of their relative performance in separating classes when working with classification problems. For linear models like logistic regression, it specifically helps tune regularization and model complexity to prevent overfitting the training data. Simple linear models like logistic regression will have linear decision boundaries. More complex models like SVM may …
Forecasting using Linear Regression: Python Example

Linear regression is a simple and widely used statistical method for modeling relationships between variables. While it can be applied to time-series data for trend analysis and basic forecasting, it is not always the most apt method for time-series forecasting due to several limitations. Forecasting using Linear Regression Forecasting using linear regression involves using historical data to predict future values based on the assumption of a linear relationship between the independent variable (time) and the dependent variable (the metric to be forecasted, like CO2 levels discussed in next section). The process typically involves the following steps: Limitations for Linear Regression used in Forecasting Is linear regression most efficient method for …
Gradient Boosting vs Adaboost Algorithm: Python Example

In this blog post we will delve into the intricacies of two powerful ensemble learning techniques: Gradient Boosting and Adaboost. Both methods are widely recognized for their ability to improve prediction accuracy in machine learning tasks, but they approach the problem in distinct ways. Gradient Boosting is a sophisticated machine learning approach that constructs models in a series, each new model specifically targeting the errors of its predecessor. This technique employs the gradient descent algorithm for error minimization and excels in managing diverse datasets, particularly those with non-linear patterns. Conversely, Adaboost (Adaptive Boosting) is a distinct ensemble strategy that amalgamates numerous simple models to form a robust one. Its defining …
Feature Importance & Random Forest – Sklearn Python Example
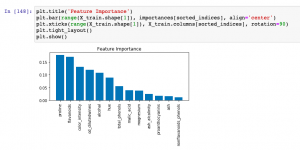
Last updated: 9th Dec, 2023 When building machine learning classification and regression models, understanding which features most significantly impact your model’s predictions can be as crucial as the predictions themselves. This post delves into the concept of feature importance in the context of one of the most popular algorithms available – the Random Forest. Whether used for classification or regression tasks, Random Forest not only offers robust and accurate predictions but also provides insightful metrics to find the most important features in your dataset. You will learn about how to use Random Forest regression and classification algorithms for determining feature importance using Sklearn Python code example. It is very important to …
Random Forest vs AdaBoost: Difference, Python Example
Last updated: 8th Dec, 2023 In this post, you will learn about the key differences between the AdaBoost and the Random Forest machine learning algorithm. Random Forest and AdaBoost algorithms can be used for both regression and classification problems. Both the algorithms are ensemble learning algorithms that construct a collection of trees for prediction. Random Forest builds multiple decision trees using diverse variables and employs bagging for data sampling and predictions. AdaBoost, on the other hand, creates an ensemble of weak learners, often in the form of decision stumps (simple trees with one node and two leaves). AdaBoost iteratively adjusts these stumps to concentrate on mispredicted areas, often leading to higher …
Logistic Regression Customer Churn Prediction: Example

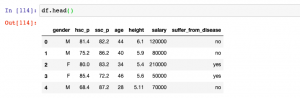
In today’s fast-paced and highly competitive business world, spanning across industries like telecommunications, finance, e-commerce, and more, the ability to predict and understand customer churn has emerged as a critical component of strategic business management. Whether it’s a telecom giant grappling with subscriber turnover, a fintech company aiming to retain its user base, or an e-commerce platform trying to reduce shopping cart abandonment, the implications of churn are vast and deeply impactful. This is where the role of logistic regression, a potent and versatile statistical method, comes into play. This blog delves into different aspects of training a logistic regression machine learning model for churn prediction, highlighting its universality and …
GLM vs Linear Regression: Difference, Examples

Linear Regression and Generalized Linear Models (GLM) are both statistical methods used for understanding the relationship between variables. Understanding the difference between GLM and Linear Regression is essential for accurate model selection, tailored to data types and research questions. It’s crucial for predicting diverse outcomes, ensuring valid statistical inference, and is vital in interdisciplinary research. In this blog, we will learn about the differences between Linear Regression and GLM by delving into their distinct characteristics, suitable applications, and the importance of choosing the right model based on data type and research objective. What’s the difference between GLM & Linear Regression? Linear Regression and Generalized Linear Models (GLM) are two closely …
MinMaxScaler vs StandardScaler – Python Examples
Last updated: 7th Dec, 2023 Feature scaling is an essential part of exploratory data analysis (EDA), when working with machine learning models. Feature scaling helps to standardize the range of features and ensure that each feature (continuous variable) contributes equally to the analysis. Two popular feature scaling techniques used in Python are MinMaxScaler and StandardScaler. In this blog, we will learn about the concepts and differences between these feature scaling techniques with the help of Python code examples, highlight their advantages and disadvantages, and provide guidance on when to use MinMaxScaler vs StandardScaler. Note that these are classes provided by sklearn.preprocessing module. As a data scientist, you will need to …
Using GridSearchCV with Logistic Regression Models: Examples

GridSearchCV method is a one of the popular technique for optimizing logistic regression models, automating the search for the best hyperparameters like regularization strength and type. It enhances model performance by incorporating cross-validation, ensuring robustness and generalizability to new data. This method saves time and ensures objective model selection, making it an essential technique in various domains where logistic regression is applied. Its integration with the scikit-learn library (sklearn.model_selection.GridSearchCV) simplifies its use in existing data pipelines, making it a valuable asset for both novice and experienced machine learning practitioners. How is GridSearchCV used with Logistic Regression? GridSearchCV is a technique used in machine learning for hyperparameter tuning. It is a …
Handling Class Imbalance in Machine Learning: Python Example
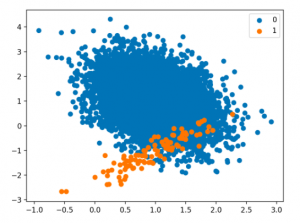
Techniques for Handling Class Imbalance Class imbalance may not always impact performance, and using imbalance-specific methods can sometimes worsen results. Xu-Ying Liu, Jianxin Wu, and Zhi-Hua Zhou, Exploratory Undersampling for Class-Imbalance Learning Above said, there are different techniques such as the following for handling class imbalance when training machine learning models with datasets having imbalanced classes. Python packages such as Imbalanced Learn can be used to apply techniques related to under-sampling majority classes, upsampling minority classes, and SMOTE. In this post, techniques related to using class weight will be used for tackling class imbalance. How to create a Sample Dataset having Class Imbalance? In this section, you will learn about how to create an …
Handling Class Imbalance using Sklearn Resample

Last updated: 5th Dec, 2023 The class imbalance problem in machine learning occurs when the classes in a dataset are not represented equally, leading to a significant difference in the number of instances for different classes. This imbalance can cause a classification model to be biased towards the majority class, resulting in poor performance on the minority class. Thus, the class imbalance hinders data scientists by challenging the development of accurate and fair models, as the skewed distribution can lead to misleading training predictions / outcomes and reduced effectiveness in real-world applications where minority classes are critical. In this post, you will learn about how to tackle class imbalance issue …
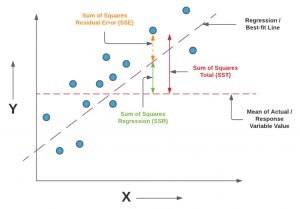
Ordinary Least Squares Method: Concepts & Examples
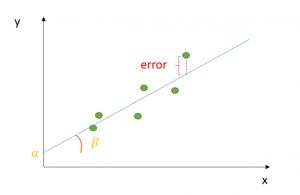
Last updated: 5th Dec, 2023 Regression analysis is a fundamental statistical technique used in many fields, from finance, econometrics to social sciences. It involves creating a regression model for modeling the relationship between a dependent variable and one or more independent variables. The Ordinary Least Squares (OLS) method helps estimate the parameters of this regression model. Ordinary least squares (OLS) is a technique used in linear regression model to find the best-fitting line for a set of data points by minimizing the residuals (the differences between the observed and predicted values). It does so by estimating the coefficients of the linear regression model by minimizing the sum of the squared …
Linear Regression vs Correlation: Examples
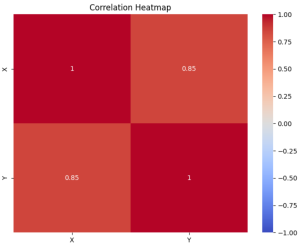
Linear regression and correlation are fundamental concepts in statistics, often used in data analysis to understand the relationship between two variables. Linear regression and correlation, while related, are not the same. They serve different purposes and provide different types of information. In this blog, we will explore each concept with examples to clarify their differences and applications. Linear Regression vs Correlation: Definition Linear Regression is a statistical method used for modeling the relationship between a dependent variable and one or more independent variables. The core idea is to find a linear equation that best describes this relationship, enabling the prediction of the dependent variable based on the values of the …
I found it very helpful. However the differences are not too understandable for me