Tag Archives: statistics
MSE vs RMSE vs MAE vs MAPE vs R-Squared: When to Use?

Last updated: 18th August, 2024 As data scientists, we navigate a sea of metrics to evaluate the performance of our regression models. Understanding these metrics – Mean Squared Error (MSE), Root Mean Squared Error (RMSE), Mean Absolute Error (MAE), Mean Absolute Percentage Error (MAPE), and R-Squared – is crucial for robust model evaluation and selection. In this blog, we delve into the intricacies of these different metrics while learning them based on clear definitions, formulas, and guidance on when to use which of these metrics. Different Types of Regression Models Evaluation Metrics The following are different types of regression model evaluation metrics including MSE, RMSE, MAE, MAPE, R-squared, and Adjusted …
How to Choose Right Statistical Tests: Examples
Last updated: 13th May, 2024 Whether you are a researcher, data analyst, or data scientist, selecting the appropriate statistical test is crucial for accurate and reliable hypothesis testing for validating any given claim. With numerous tests available, it can be overwhelming to determine the right statistical test for your research question and data type. In this blog, the aim is to simplify the process, providing you with a systematic approach to choosing the right statistical test. This blog will be particularly helpful for those new to statistical analysis and unsure which test to use for their specific needs. You will learn a clear and structured method for selecting the appropriate …
Linear Regression T-test: Formula, Example
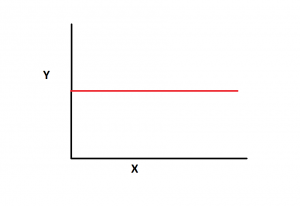
Last updated: 7th May, 2024 Linear regression is a popular statistical method used to model the relationship between a dependent variable and one or more independent variables. In linear regression, the t-test is a statistical hypothesis testing technique used to test the hypothesis related to the linearity of the relationship between the response variable and different predictor variables. In this blog, we will discuss linear regression and t-test and related formulas and examples. For a detailed read on linear regression, check out my related blog – Linear regression explained with real-life examples. T-tests are used in linear regression to determine if a particular independent variable (or feature) is statistically significant …
Natural Language Processing (NLP) Task Examples

Last updated: 5th Jan, 2024 Have you ever wondered how your phone’s voice assistant understands your commands and responds appropriately? Or how search engines are able to provide relevant results for your queries? The answer lies in Natural Language Processing (NLP), a subfield of artificial intelligence (AI) that focuses on enabling machines to understand and process human language. NLP is becoming increasingly important in today’s world as more and more businesses are adopting AI-powered solutions to improve customer experiences, automate manual tasks, and gain insights from large volumes of textual data. With recent advancements in AI technology, it is now possible to use pre-trained language models such as ChatGPT to …
Cohen Kappa Score Explained: Formula, Example
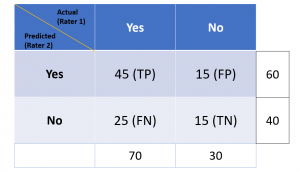
Last updated: 5th Jan, 2024 Cohen’s Kappa Score is a statistic used to measure the performance of machine learning classification models. In this blog post, we will discuss what Cohen’s Kappa Score is and Python code example representing how to calculate Kappa score using Python. We will also provide a code example so that you can see how it works! What is Cohen’s Kappa Score or Coefficient? Cohen’s Kappa Score, also known as the Kappa Coefficient, is a statistical measure of inter-rater agreement for categorical data. Cohen’s Kappa Coefficient is named after statistician Jacob Cohen, who developed the metric in 1960. It is generally used in situations where there …
Online Scatter Plot Maker – Works with Your Excel Data
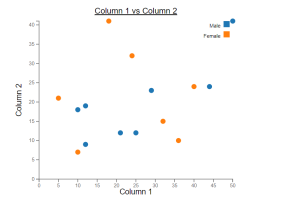
This online free tool, scatter plot creator, is designed to make data scatter plot visualization simpler, more efficient, and more integrated into your reporting. Scatter plots are invaluable for examining the relationship between two variables, identifying trends, outliers, and patterns. Whether you’re a data scientist, researcher, or data enthusiast, this tool will enable you to visualize your data effectively using scatter plots. The following are key features of this online scatter plot maker tool: Create Scatter Plots
Independent Samples T-test: Formula, Examples, Calculator
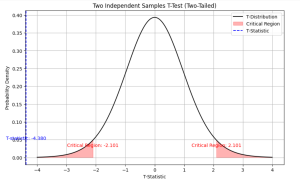
Last updated: 21st Dec, 2023 As a data scientist, you may often come across scenarios where you need to compare the means of two independent samples. In such cases, a two independent samples t-test, also known as unpaired two samples t-test, is an essential statistical tool that can help you draw meaningful conclusions from your data. This test allows you to determine whether the difference between the means of two independent samples is statistically significant or due to chance. In this blog, we will cover the concept of independent samples t-test, its formula, real-world examples of its applications and the Python & Excel example (using scipy.stats.ttest_ind function). We will begin …
Z-test vs T-test: Formula, Examples
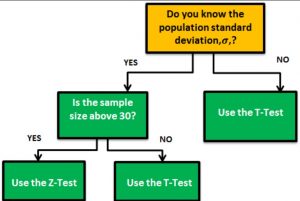
Last updated: 18th Dec, 2023 When it comes to statistical tests, z-test and t-test are two of the most commonly used. But what is the difference between z-test and t-test? And when to use z-test vs t-test? In this relation, we also wonder about z-statistics vs t-statistics. And, the question arises around what’s the difference between z-statistics and t-statistics. In this blog post, we will answer all these questions and more! We will start by explaining the difference between z-test and t-test in terms of their formulas. Then we will go over some examples so that you can see how each test is used in practice. As data scientists, it …
Standard Deviation of Population vs Sample
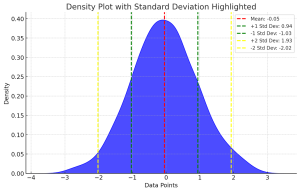
Last updated: 18th Dec, 2023 Have you ever wondered what the difference between standard deviation of population and a sample? Or why and when it’s important to measure the standard deviation of both? In this blog post, we will explore what standard deviation is, the differences between the standard deviation of population and samples, and how to calculate their values using their formula and Python code example. By the end of this post, you should have a better understanding of standard deviation in general and why it’s important to calculate it for both populations and samples. Check out my related post – coefficient of variation vs standard deviation. What is …
One-Sample T-Test Calculator

Here are two different methods of calculating t-statistics for one-sample t-test. In method 1, you enter the dataset. In method 2, you provide the sample mean, sample standard deviation and sample size. Here are the common set of inputs. One of the input field is the hypothesized mean, which is the population mean you expect or hypothesizes before conducting the test. This value is crucial for comparison against the sample mean. By default, it is set to 0, but you can modify it based on their hypothesis. The significance level, another critical input, is pre-set at 0.05 but can be adjusted. This level determines the threshold for statistical significance. In …
One Sample T-test: Formula & Examples
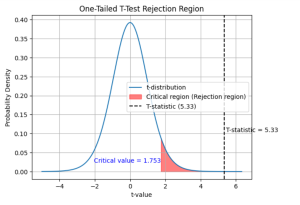
Last updated: 16th Dec, 2023 In statistics, the t-test is often used in research when the researcher wants to know if there is a significant difference between the mean of sample and the population, or whether there is a significant difference between the means of two groups (unpaired / independent or paired). There are three types of t-tests: the one sample t-test, two samples or independent samples t-test, and paired samples t-test. In this blog post, we will focus on the one sample t-test and explain with formula and examples. As data scientists, it is important for us to understand the concepts of t-test and how to use it in …
Linear Regression vs. Polynomial Regression: Python Examples
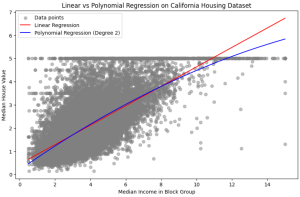
In the realm of predictive modeling and data science, regression analysis stands as a cornerstone technique. It’s essential for understanding relationships in data, forecasting trends, and making informed decisions. This guide delves into the nuances of Linear Regression and Polynomial Regression, two fundamental approaches, highlighting their practical applications with Python examples. What are Linear and Polynomial Regression? In this section, we will learn about what are linear and polynomial regression. What is Linear Regression? Linear Regression is a statistical method used in predictive analysis. It’s a straightforward approach for modeling the relationship between a dependent variable (often denoted as y) and one or more independent variables (denoted as x). In …
Linear Regression in Machine Learning: Python Examples
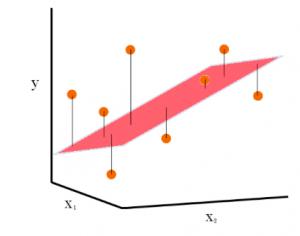
Last updated: 15th Dec, 2023 In this post, the linear regression concepts in machine learning is explained with multiple real-life examples. Two types of regression models (simple/univariate and multiple/multivariate linear regression) are taken up for sighting examples. In addition, Python code examples are used for demonstrating training of simple linear and multiple linear regression models. In case you are a machine learning or data science beginner, you may find this post helpful enough. You may also want to check a detailed post – What is Machine Learning? Concepts & Examples. What is Linear Regression? Linear regression is a machine learning concept that is used to build or train the models …
F-test & F-statistics in Linear Regression: Formula, Examples
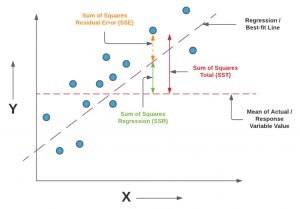
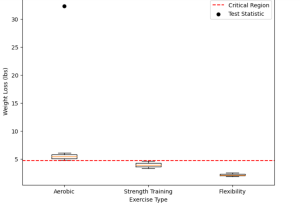
Last updated: 11th Dec, 2023 In this blog post, we will take a look at the concepts and formula of f-test and related f-statistics in linear regression models and understand how to perform f-test and interpret f-statistics in linear regression with the help of examples. F-test and related F-statistics interpretation is key if you want to assess if the linear regression model results in a statistically significant fit to the data overall. An insignificant F-test determined by the f-statistics value vis-a-vis critical region implies that the predictors have no linear relationship with the target variable. We will start by discussing the importance of F-test and f-statistics in linear regression models …
GLM vs Linear Regression: Difference, Examples

Linear Regression and Generalized Linear Models (GLM) are both statistical methods used for understanding the relationship between variables. Understanding the difference between GLM and Linear Regression is essential for accurate model selection, tailored to data types and research questions. It’s crucial for predicting diverse outcomes, ensuring valid statistical inference, and is vital in interdisciplinary research. In this blog, we will learn about the differences between Linear Regression and GLM by delving into their distinct characteristics, suitable applications, and the importance of choosing the right model based on data type and research objective. What’s the difference between GLM & Linear Regression? Linear Regression and Generalized Linear Models (GLM) are two closely …
Using GridSearchCV with Logistic Regression Models: Examples

GridSearchCV method is a one of the popular technique for optimizing logistic regression models, automating the search for the best hyperparameters like regularization strength and type. It enhances model performance by incorporating cross-validation, ensuring robustness and generalizability to new data. This method saves time and ensures objective model selection, making it an essential technique in various domains where logistic regression is applied. Its integration with the scikit-learn library (sklearn.model_selection.GridSearchCV) simplifies its use in existing data pipelines, making it a valuable asset for both novice and experienced machine learning practitioners. How is GridSearchCV used with Logistic Regression? GridSearchCV is a technique used in machine learning for hyperparameter tuning. It is a …
I found it very helpful. However the differences are not too understandable for me