Category Archives: Data Science
Upcoming Online Demos on AI/Data Science (13th – 18th Nov)

The following is the list of upcoming online demos on AI/Data Science in this week (13th – 18th Nov 2017). Company Topic Date/Time Details AI/Data Science Online Demo 18th Nov (11:00 AM) Drop us an email Data Science – Machine Learning with Python 18th Nov (11:00 AM to 12:00 PM) Register
Machine Learning (Decision Trees, SVM) Quiz by DeepAlgorithms.in

This quiz is sponsored by DeepAlgorithms.in, a leading data science / machine learning training/consultancy provider (classroom coaching / online courses) based out of Hyderabad, India. Contact DeepAlgorithms to know details about their upcoming classroom/online training sessions. These questions can as well be used for checking/testing your for knowledge on data science for upcoming interviews. Following are some of the topics which are covered as part of this quiz: Classification Decision trees Ensemble model SVM KNN [wp_quiz id=”5710″]
Machine Learning (Regression) Quiz by DeepAlgorithms.in

This quiz is sponsored by DeepAlgorithms.in, a leading data science / machine learning training/consultancy provider (classroom coaching / online courses) based out of Hyderabad, India. Contact DeepAlgorithms to know details about their upcoming classroom/online training sessions. These questions can as well be used for checking/testing your for knowledge on data science for upcoming interviews. [wp_quiz id=”5698″]
Azure Machine Learning (ML) Certifications
This blog represents a list of Azure certifications for data scientists, machine learning (ML) enthusiasts. Analysing Big Data with Microsoft R The following is a list of some of the topics covered as part of this certification: Read and explore big data Process big data Build predictive models with ScaleR Use R Server in different environments This certification costs $165.00. Greater details can be found on the page, Analysing Big Data with Microsoft R Perform Cloud Data Science with Azure Machine Learning The following is a list of some of the topics covered as part of this certification: Prepare Data for Analysis in Azure Machine Learning and Export from Azure …
Machine Learning Course Outline

This is a list of topics which can be covered as part of machine learning course curriculum. In other words, it is a representation of outline of a machine learning course. This course outline is created by taking into considerations different topics which are covered as part of machine learning courses available on Coursera.org, Edx, Udemy etc. In case, you are planning to take up a machine learning course in near future, make sure that most of the following is covered. An Outline to Machine Learning Course Curriculum Introduction to machine learning Regression Linear Regression with One Variable Linear Regression with Multiple Variables Logistic Regression Introduction to Neural Networks Representation …
Learn R – How to Define Function in R
This article represents code examples in relation with how to write function in R. Please feel free to comment/suggest if I missed to mention one or more important points. Also, sorry for the typos. Following are the key points described later in this article: Function Definition Code Examples for Functions How to Define Function Function in R looks like following: # Function definition funcName <- function( a, b, c ) { return(v) # or simply v } # This is how a function is invoked var1 <- funcName(x,y,x) In above code, funcName is the name of the function. a, b, c are parameters. v is return variable Code Examples …
Learn R – How to Create Multiple Density Plots using GGPlot
This article represents code samples which could be used to create multiple density curve or plots using ggplot2 package in R programming language. Please feel free to comment/suggest if I missed to mention one or more important points. Also, sorry for the typos. Multiple Density Curves/Graphs with GGPlot The code samples given below works for “diamonds” dataset which is loaded as part of ggplot2 package. Following are two different types of plots shown below: Density plots with multiple fills Density plot with single fill Density Plots with Multiple Fills:Following code represents density plots with multiple fills. Pay attention to the “fill” parameter passed to “aes” method. # Create density plots for …
Learn R – 3 Commands to Generate Random Numbers
This article represents 3 different commands with code examples which could be used to generate random numbers in R programming language. Please feel free to comment/suggest if I missed to mention one or more important points. Also, sorry for the typos. Following are the key points described later in this article: Runif command Sample command Rnorm command Difference between runif and rnorm command Runif: Generate Random Numbers based on Uniform Distribution “Runif” command can be used for generating random numbers based on uniform distribution. One can generate one or more random numbers within a range of numbers. One should note that the random numbers generated using runif commands are all …
Learn R – Extract Data Frame with One Column
This article represents code sample that could be used to create/extract data frame with one column from existing data frame. Please feel free to comment/suggest if I missed to mention one or more important points. Also, sorry for the typos. Extract Data Frame with One Column In the code sample below, diamonds dataset from ggplot2 package is used. To work with the example below, one needs to load the ggplot2 library using command such as require(“ggplot2”). In the command below, method as.data.frame is used. Make a note of drop=false parameter passed to as.data.frame method. dfn1 <- as.data.frame(diamonds[,c(1)], drop=false)
Learn R – How to Create Histogram using GGPlot
This article represents techniques (commands samples) which could be used to create histogram using ggplot2 package in R programming. Please feel free to comment/suggest if I missed to mention one or more important points. Also, sorry for the typos. Following is the summary of commands used to create histogram using ggplot: Using simplistic ggplot and geom_histogram method Using ggplot and geon_histogram command with attributes such as col, fill, alpha Using ggplot, geom_histogram and scale_fill_gradient method Common Techniques to Create Histogram using ggplot2 In the code examples below, diamonds dataset from ggplot2 package is used. To work with examples below, load the ggplot2 library prior to executing the commands given below. …
Learn R – How to Create Data Frames using Existing Data Frame
This article represents commands that could be used to create data frames using existing data frame. Please feel free to comment/suggest if I missed to mention one or more important points. Also, sorry for the typos. Following is a list of command summary for creating data frames by extracting multiple columns from existing data frame based on following criteria, whose sample is provided later in this article: Column indices Column names Subset command Data.frame command 6 Techniques for Extracting Data Frame from Existing Data Frames Following commands have been based on diamonds data frame which is loaded as part of loading ggplot2 library. Following is how the diamonds data …
Learn R – 5 Techniques to Create Empty Data Frames with Column Names
This article represents techniques on how one could create an empty data frame with column names. Please feel free to comment/suggest if I missed to mention one or more important points. Also, sorry for the typos. 5 Techniques to Create Empty Data Frames In each of the examples below, the data frame is created with three columns, namely, ‘name’, ‘rating’, ‘relyear’. It represents moview names, ratings, and the release year. # Command data.frame is used df1 <- data.frame(name=””, rating=””, relyear=””, stringsAsFactors=FALSE) # Command data.frame is used df2 <- data.frame(name=character(), rating=character(), relyear=character(), stringsAsFactors=FALSE) # Usage of read.table command to create empty data frame df3 <- read.table(text = “”, colClasses = c(“character”, …
Data Science – How to Scale or Normalize Numeric Data using R
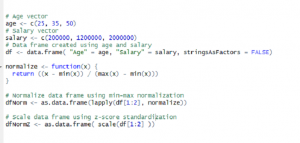
This article represents concepts around the need to normalize or scale the numeric data and code samples in R programming language which could be used to normalize or scale the data. Please feel free to comment/suggest if I missed mentioning one or more important points. Also, sorry for the typos. Following are the two different ways which could be used to normalize the data, and thus, described later in this article: Why Normalize or Scale the data? Min-Max Normalization Z-Score Standardization Why Normalize or Scale the data? There can be instances found in data frame where values for one feature could range between 1-100 and values for other feature could …
I found it very helpful. However the differences are not too understandable for me