Category Archives: Data
Data Lakehouses Fundamentals & Examples
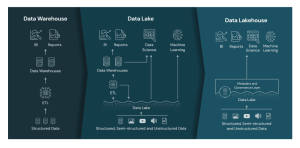
Last updated: 12th May, 2024 Data lakehouses are a relatively new concept in the data warehousing space. They combine the scalability and cost-effectiveness of cloud storage-based data lakes with the flexibility, security, and performance of traditional data warehouses to create a powerful data management solution. But what exactly is a data lakehouse, how does it work, and how might it be used in your organization? In this blog post, we’ll explore the basics of data lakehouses and provide real-world examples to illustrate their value. What is a Data Lakehouse? Simply speaking, data lakehouses combine elements from both data warehouses and data lakes — hence the name “data lakehouse” — to …
Machine Learning Lifecycle: Data to Deployment Example
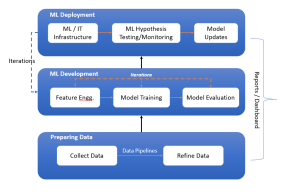
Last updated: 12th May 2024 In this blog, we get an overview of the machine learning lifecycle, from initial data handling to the deployment and iterative improvement of ML models. You might want to check out this book for greater insights into machine learning (ML) concepts – Machine Learning Interviews. The following is the diagram representing the machine learning lifecycle while showcasing three key stages such as preparing data, ML development, and ML deployment. These three stages are explained later in this blog. Stage A: Preparing Data Preparing data for training machine learning models involves collecting data, constructing data pipelines for preprocessing, and refining the data to prepare it for …
AI-Ready Data Explained with Examples

AI-ready data usually refers to data that has been prepared in such a way that it can be effectively used for training artificial intelligence (AI) and generative AI models. In this blog, we will learn about what are the most common attributes of AI-ready data. The following are the top most 5 attributes that AI-ready data would need to have. Data must be: Check out this Gartner paper for further details – We Shape AI, AI shapes us.
NLP Corpus Types (Text & Multimodal): Examples

At the heart of NLP lies a fundamental element: the corpus. A corpus, in NLP, is not just a collection of text documents or utterances; it’s at the core of large language models (LLMs) training. Each corpus type serves a unique purpose in terms of training language models that serve different purposes. Whether it’s a collection of written texts, transcriptions of spoken words, or an amalgamation of various media forms, each corpus type holds the key to leveraging different aspects of language to generate value. In this blog, we’re going to explore the significance of these different corpora types in NLP. From the traditional text corpora consisting of written content …
Mastering Data Quality KPI Dashboards: Concepts, Examples

In the digital age, where data is often likened to the new oil, ensuring its quality is not just an operational necessity but a strategic imperative. In every organization, from small startups to global enterprises, the ability to trust and accurately interpret data can be the difference between insightful business decisions and costly missteps. This is where data quality Key Performance Indicators (KPIs) and their visualization through dashboards become pivotal. In this blog, we aim to navigate you through the multifaceted world of data quality, focusing on understanding, designing, and implementing effective KPI dashboards. Whether you’re a data analyst, a business intelligence professional, or just someone passionate about data-driven decision-making, …
Types of SQL Joins: Differences, SQL Code Examples

Structured Query Language (SQL) is one of the most important and widely used tools for data manipulation. It allows users to interact with databases, query and manipulate data, and create reports. One of SQL’s most important features is its ability to join tables together in order to enrich, compare and analyze related data. These joins are termed as inner join, outer join, left join and right join. In this article, we will discuss the different types of joins available in SQL, their differences and provide examples of how each can be used. What is SQL Join? SQL Joins are a technique used in Structured Query Language (SQL) to combine two …
Data Ingestion Types – Concepts & Examples
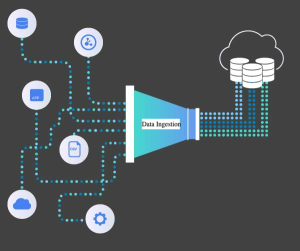
Last updated: 17th Nov, 2023 Data ingestion is the process of moving data from its original storage location to a data warehouse or other database for analysis. Data engineers are responsible for designing and managing data ingestion pipelines. Data can be ingested in different modes such as real-time, batch mode, etc. In this blog, we will learn the concepts about different types of data ingestion with the help of examples. What is Data Ingestion? Data ingestion is the foundational process of importing, transferring, loading, and processing data from various sources into a storage medium where it can be accessed, used, and analyzed by an organization. It’s akin to the first …
Histogram Plots using Matplotlib & Pandas: Python

Executing the above code will print the following Histogram. Plotting multiple Histograms Side-by-Side using Matplotlib & Pandas When you want to understand the distribution of data with respect to different characteristics, you could plot the side-by-side or multiple histograms on the same plot. For example, when you want to understand the distribution of housing prices with respect to different values of accessibility to radial highways, you would want to print the histograms side-by-side on the same plot. Here is the code representing the printing of histogram plots side-by-side on the same plot: Here is how the side-by-side histogram plot would look like: Creating Stacked Histogram Plots using Matplotlib & Pandas …
Linear Regression Datasets: CSV, Excel
Linear regression is a fundamental machine learning algorithm that helps in understanding the relationship between independent and dependent variables. It is widely used in various fields for predicting numerical outcomes based on one or more input features. To practice and learn about linear regression, it is essential to have access to good quality datasets. In this blog, we have compiled a list of 17 datasets suitable for training linear regression models, available in CSV or easily convertible to CSV (Excel) format. I have also provided a sample Python code you can use to train using these datasets. List of Dataset for Training Linear Regression Models The following is a list …
Unemployment Data & Actionable Insights Examples
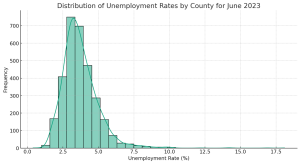
Unemployment figures often flood the news, painting a broad picture of economic stability or crisis. But have you ever wondered how these rates break down at the local level? Do certain counties (or cities) in different states fare better or worse than the national average, and if so, why? Unemployment is a critical indicator of economic health and social well-being. While national or state-level unemployment rates often make headlines, diving deeper into county-level or city level data can offer valuable insights for local governments, policymakers, and social organizations. In this blog, we will explore a dataset that provides unemployment rates for various U.S. counties in June 2023. Along the way, …
How to Identify Analytics Use Cases for Solving Business Problems
In today’s data-driven world, data analytics has become a key aspect of business decision making. Organizations are increasingly relying on data analytics to gain insights into their operations and customers, in order to drive growth and profitability. However, the challenge for many businesses is not in understanding the importance of analytics, but in identifying the right use cases for their particular business problems, execute those use cases and deliver in a timely manner. This is where a structured approach to identifying analytics use cases becomes critical. In this blog post, we will explore how product managers and data scientists can work with business owners and identify analytics use cases that …
Data Analytics Explained: What, Why & How?
Data analytics has become a buzzword in the business world today, and for all good reasons indeed as it brings competitive advantage to the business if leveraged in the most appropriate manner. The ability to collect, process, and analyze large amounts of data in order to solve business problems has given organizations unprecedented insights into their operations, customers, and markets. By leveraging these insights, businesses can make informed decisions also called as data-driven decisions, identify new opportunities, and drive growth. But what exactly is data analytics? What are the different forms of data analytics? Why is it so important? And how can businesses leverage it to their advantage? How can …
Data value chain: Framework, Concepts
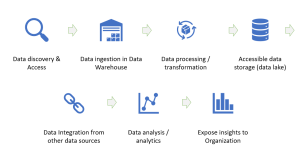
As organizations become increasingly data-driven, understanding the value of data is critical for success. The data value chain framework helps to identify and maximize the value of data by breaking it down into its components. In this post, we will explain what a data value chain is, why it’s important, and how to implement it. Data Value Chain Framework: Key Stages The data value chain (DVC) is a business model that helps organizations understand how to create, manage and utilize their data assets in order to realize maximum business value based on using them. It breaks down the various stages of an organization’s entire journey with its data into distinct …
Data Analysis Types: Concepts & Examples
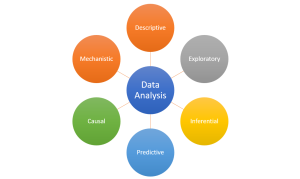
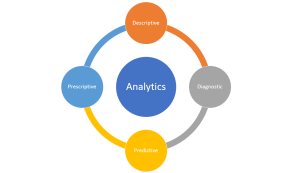
Data analysis plays an important role in understanding the world, discovering trends, and making decisions. Having a good understanding of the different types of data analysis available is essential for anyone looking to make sense of their data. In this blog post, we’ll discuss the six different forms of data analysis and provide examples of each type so you can get a better idea of how they work. The following is a representation of six forms of data analysis. Before getting ahead and understand different form of analysis, lets understand what is Data Analysis? The word “analysis” comes from the Ancient Greek ἀνάλυσις (analysis, “a breaking-up” or “an untying;” from …
Data Quality Characteristics & Examples
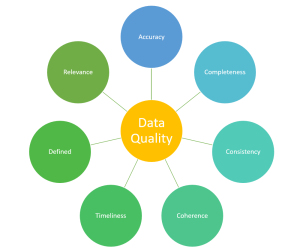
It is no secret that data is an essential component in the day-to-day operations of businesses—as well as the decision making processes. To ensure trust and reliability on the data, organizations must pay close attention to the quality of their data. In this blog post, we will discuss some of the key characteristics that make up quality data, diving into each characteristic and providing examples along the way. Good data governance strategies are also essential for maintaining high quality datasets across an organization’s entire IT infrastructure. These strategies include quality control processes for entering new data into the system; establishing internal documents with procedures for validating all incoming information; assigning …
Questions to Ask Before Starting Data Analysis
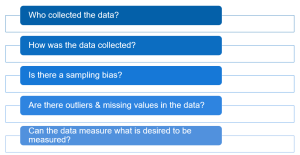
Data analysis is a crucial part of any business or organization. It helps make decisions and assists in strategy development. But before you can dive into the data, there are several questions that need to be answered first. These questions will help you understand whether you have right kind of data for analysis purpose in addition to defining your goals for data analysis. As data scientists or data analysts, it is your job to ask the right questions. Let’s take a look at some important questions to ask before starting data analysis. Who collected the data? When it comes to data analysis, it is essential to know who collected the …
I found it very helpful. However the differences are not too understandable for me