The Watermelon Effect: When Green Metrics Lie
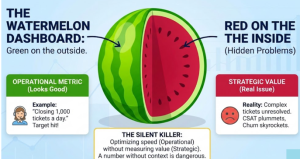
We’ve all been in that meeting. The dashboard on the boardroom screen is a sea of bright green. The “Clinic Utilization” metric is at 100%. The “Ticket Volume” is up. The Head of Operations is celebrating a record-breaking month of efficiency. But across the table, the CFO is frowning. “If we’re doing so well,” she asks, “why is our margin down 5%?” Meanwhile, the Store Manager is slumped in his chair. “We are drowning,” he mutters. “My staff is so busy managing the queues that we can’t even restock the shelves.” This is the paradox of modern analytics. We have more data than ever, yet we are often flying blind. …
Coefficient of Variation in Regression Modelling: Example
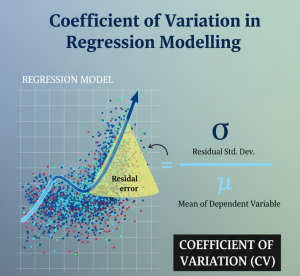
When building a regression model or performing regression analysis to predict a target variable, understanding the characteristics of your data including both independent and dependent variable is key. While descriptive statistics like the mean and standard deviation provide a basic summary, they don’t always tell the whole story, especially when comparing variables with different scales. This is where the Coefficient of Variation (CV) shines. The Coefficient of Variation is a standardized measure of dispersion that expresses the standard deviation as a percentage of the mean. The formula is simple: CV = (Standard Deviation / Mean) * 100% Unlike the standard deviation, which is an absolute measure of variability, the CV …
Chunking Strategies for RAG with Examples
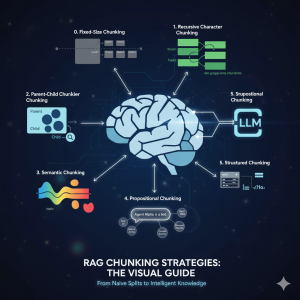
If you’ve built a “Naive” RAG pipeline, you’ve probably hit a wall. You’ve indexed your documents, but the answers are… mediocre. They’re out of context, they miss the point, or they just feel wrong. Here’s the truth: Your RAG system is only as good as its chunks. Chunking—the process of breaking your documents into searchable pieces—is one of the most important decision you will make in your RAG pipeline. It’s not just “preprocessing”; it is the foundation of your AI’s knowledge in the RAG application. The problem is what I call the “Chunking Goldilocks Problem”: Let’s walk through the evolution of chunking strategies, from the simple baseline to the state-of-the-art, …
RAG Pipeline: 6 Steps for Creating Naive RAG App
If you’re starting with large language models, you must have heard of RAG (Retrieval-Augmented Generation). It’s the magic that lets AI chatbots talk about your data—your company’s PDFs, your private notes, or any new information—without “hallucinating.” It might sound complex, but the core logic of a simple RAG pipeline can be boiled down to six simple steps. We’re going to walk through the “conductor” script that runs this pipeline, showing you how data flows from a raw document to a smart, factual answer. Our entire system is built on this simple mantra: Let’s look at the Python code that brings this mantra to life. Step 0: Loading Our “Brains” (The …
Python: List Comprehension Explained with Examples
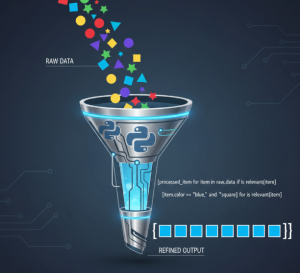
If you’ve spent any time with Python, you’ve likely heard the term “Pythonic.” It refers to code that is not just functional, but also clean, readable, and idiomatic to the Python language. One of the most powerful tools for writing Pythonic code is the list comprehension, a feature that allows you to build lists in a single, elegant line. While traditional for loops are perfectly capable of creating lists, list comprehensions offer a more concise and often more efficient alternative. Let’s explore how they work and why you should be using them. From for Loop to Comprehension At its core, a list comprehension is a syntactic shortcut for a for loop that builds a list. Imagine you …
Large Language Models (LLMs): Four Critical Modeling Stages
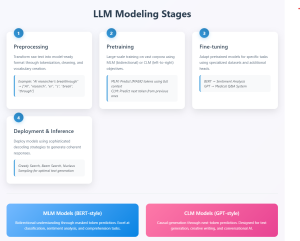
Large language models (LLMs) have fundamentally transformed our digital landscape, powering everything from chatbots and search engines to code generators and creative writing assistants. Yet behind every seemingly effortless AI conversation lies a sophisticated multi-stage modeling process that transforms raw text into intelligent, task-specific systems capable of human-like understanding and generation. Understanding the LLM modeling stages described later in this blog is crucial to be able to create pre-trained model and finetune them. Let’s explore and learn about these LLM modeling stages. Stage 1: Preprocessing – Laying the Foundation The preprocessing stage involves transforming raw text data into a format suitable for model training. This includes segmenting the raw text …
Agentic Workflow Design Patterns Explained with Examples

As Large Language Models (LLMs) evolve into autonomous agents, understanding agentic workflow design patterns has become essential for building robust agentic AI systems. These patterns represent proven architectural approaches that determine how AI agents coordinate, make decisions, and solve complex problems. These design patterns can be used in several use cases including enterprise automation, software development, research analysis, content creation, customer service, and process orchestration. The following nine design patterns represent foundational architectures that can be used for building agentic workflow systems. Learn from this visual animation – Agentic Workflow Design Patterns. Policy-Only Workflows Uses LLMs as direct policy models to generate actions or plans without search or feedback loops. …
What is Data Strategy?

In today’s data-driven business landscape, organizations are constantly seeking ways to harness the power of their information assets. Yet many struggle with a fundamental question: what exactly is data strategy, and how can it drive meaningful business outcomes? In this blog, we will learn about how do we think and create data strategy. In next blogs, I will expand further on key components of data strategy. In case, you would like to discuss or learn, feel free to reach out to me on Linkedin. Defining Data Strategy When we talk about data strategy, we’re specifically talking about data strategy for business – strategy designed to achieve desired business objectives. At …
Mathematics Topics for Machine Learning Beginners
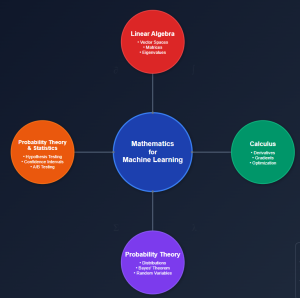
In this blog, you would get to know the essential mathematical topics you need to cover to become good at AI & machine learning. These topics are grouped under four core areas including linear algebra, calculus, multivariate calculus and probability theory & statistics. Linear Algebra Linear algebra is arguably the most important mathematical foundation for machine learning. At its core, machine learning is about manipulating large datasets, and linear algebra provides the tools to do this efficiently. Vector Spaces and Operations Matrices: Your Data’s Best Friend Eigenvalues and Eigenvectors Matrix Decompositions Calculus Machine learning is fundamentally about optimization – finding the best parameters that minimize error in the loss function. …
Questions to Ask When Thinking Like a Product Leader
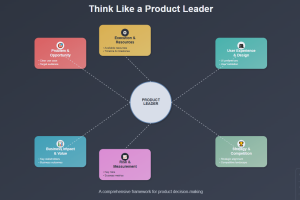
This blog represents a list of questions you can ask when thinking like a product leader. The topic includes identifying problem & opportunity, getting business impact clarity, understanding different aspects of user experience & design, success & measurement criteria, etc. If you are starting on with an exercise to solve a business problem and therefore exploring and selecting a product, you might find these questions useful. Core Problem & Opportunity Product leaders must first establish a crystal-clear understanding of the problem they’re solving and the opportunity it represents. This foundational work involves deeply understanding your target users, their pain points, and the real-world scenarios where your solution will add value. …
Three Approaches to Creating AI Agents: Code Examples
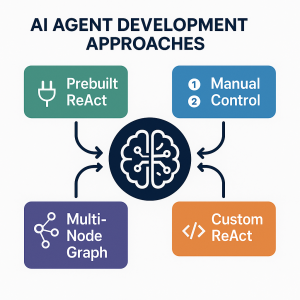
AI agents are autonomous systems combining three core components: a reasoning engine (powered by LLM), tools for external actions, and memory to maintain context. Unlike traditional AI-powered chatbots (created using DialogFlow, AWS Lex), agents can interact with end user based on planning multi-step workflows, use specialized tools, and make decisions based on previous results. In this blog, we will learn about different approaches for building agentic systems. The blog represents Python code examples to explain each of the approaches for creating AI agents. Before getting into the blog, lets quickly look at the set up code which will be basis for code used in the approaches. To explain different approaches, …
What is Embodied AI? Explained with Examples
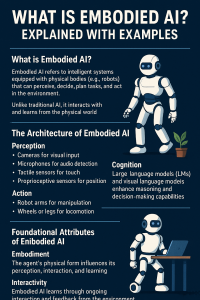
Artificial Intelligence (AI) has evolved significantly, from its early days of symbolic reasoning to the emergence of large language models that rely on internet-scale data. Now, a new frontier is taking shape— Embodied AI that leverages Agentic AI. These systems move beyond static data processing to actively interact with and learn from the real world. Embodied AI, in particular, refers to intelligent agentic AI systems with physical presence—robots, drones, humanoids—that sense, reason, and act in physical environments. Together with Agentic AI, which emphasizes autonomy, goal-directed behavior, and decision-making over time, these developments represent a shift toward more dynamic, adaptive, and human-like forms of intelligence that integrate perception, cognition, and action. …
Retrieval Augmented Generation (RAG) & LLM: Examples
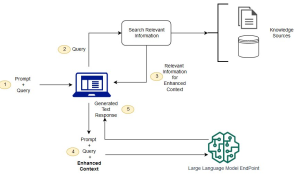
Last updated: 25th Jan, 2025 Have you ever wondered how to seamlessly integrate the vast knowledge of Large Language Models (LLMs) with the specificity of domain-specific knowledge stored in file storage, relational databases, graph databases, vector databases, etc? As the world of LLMs continues to evolve, the need for more sophisticated and contextually relevant responses from LLMs becomes paramount. Lack of contextual knowledge can result in LLM hallucination thereby producing inaccurate, unsafe, and factually incorrect responses. This is where question & context augmentation to prompts is used for contextually sensitive answer generation with LLMs, and, the retrieval-augmented generation method, comes into the picture. For data scientists and product managers keen …
How to Setup MEAN App with LangChain.js
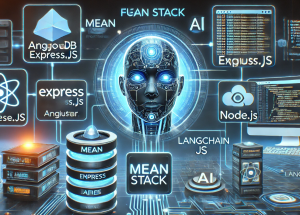
Hey there! As I venture into building agentic MEAN apps with LangChain.js, I wanted to take a step back and revisit the core concepts of the MEAN stack. LangChain.js brings AI-powered automation and reasoning capabilities, enabling the development of agentic AI applications such as intelligent chatbots, automated customer support systems, AI-driven recommendation engines, and data analysis pipelines. Understanding how it integrates into the MEAN stack is essential for leveraging its full potential in creating these advanced applications. So, I put together this quick learning blog to share what I’ve revisited. The MEAN stack is a popular full-stack JavaScript framework that consists of MongoDB, Express.js, Angular, and Node.js. Each component plays …
Build AI Chatbots for SAAS Using LLMs, RAG, Multi-Agent Frameworks
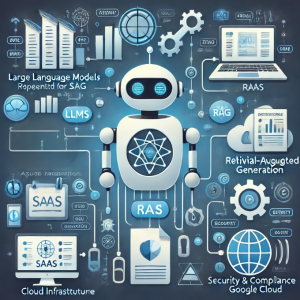
Software-as-a-Service (SaaS) providers have long relied on traditional chatbot solutions like AWS Lex and Google Dialogflow to automate customer interactions. These platforms required extensive configuration of intents, utterances, and dialog flows, which made building and maintaining chatbots complex and time-consuming. The need for manual intent classification and rule-based conversation logic often resulted in rigid and limited chatbot experiences, unable to handle dynamic user queries effectively. With the advent of generative AI, SaaS providers are increasingly adopting Large Language Models (LLMs), Retrieval-Augmented Generation (RAG), and multi-agent frameworks such as LangChain, LangGraph, and LangSmith to create more scalable and intelligent AI-driven chatbots. This blog explores how SaaS providers can leverage these technologies …
Creating a RAG Application Using LangGraph: Example Code
Retrieval-Augmented Generation (RAG) is an innovative generative AI method that combines retrieval-based search with large language models (LLMs) to enhance response accuracy and contextual relevance. Unlike traditional retrieval systems that return existing documents or generative models that rely solely on pre-trained knowledge, RAG technique dynamically integrates context as retrieved information related to query with LLM outputs. LangGraph, an advanced extension of LangChain, provides a structured workflow for developing RAG applications. This guide will walk through the process of building a RAG system using LangGraph with example implementations. Setting Up the Environment To get started, we need to install the necessary dependencies. The following commands will ensure that all required LangChain …

I found it very helpful. However the differences are not too understandable for me