Category Archives: Data Science
MSE vs RMSE vs MAE vs MAPE vs R-Squared: When to Use?

Last updated: 18th August, 2024 As data scientists, we navigate a sea of metrics to evaluate the performance of our regression models. Understanding these metrics – Mean Squared Error (MSE), Root Mean Squared Error (RMSE), Mean Absolute Error (MAE), Mean Absolute Percentage Error (MAPE), and R-Squared – is crucial for robust model evaluation and selection. In this blog, we delve into the intricacies of these different metrics while learning them based on clear definitions, formulas, and guidance on when to use which of these metrics. Different Types of Regression Models Evaluation Metrics The following are different types of regression model evaluation metrics including MSE, RMSE, MAE, MAPE, R-squared, and Adjusted …
K-Fold Cross Validation in Machine Learning – Python Example
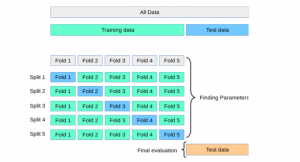
Last updated: 16th Aug, 2024 In this post, you will learn about K-fold Cross-Validation concepts used while training machine learning models with the help of Python code examples. K-fold cross-validation is a data splitting technique that is primarily used for assessing the model accuracy given smaller datasets. This technique can be implemented with k > 1 folds where k is equal number of data splits. K-Fold Cross Validation is also known as k-cross, k-fold cross-validation, k-fold CV, and k-folds. The k-fold cross-validation technique can be implemented easily using Python with scikit learn (Sklearn) package which provides an easy way to implement training of k-fold cross-validation models. It is important to learn the …
Gradient Boosting Machines (GBM): Concepts, Examples
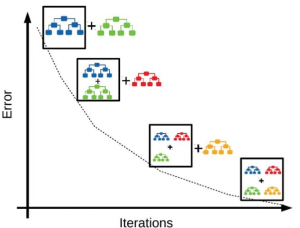
Last updated: 16th August, 2024 Gradient Boosting Machines (GBM) Algorithm is considered as one of the most powerful ensemble machine learning algorithms used for both regression and classification problems. This algorithm has been proven to increase the accuracy of predictions and is found to be extremely popular among data scientists. Let’s take a closer look at GBM and explore how it works with an example. What is a Gradient Boosting Machines Algorithm? Gradient boosting algorithm is an ensemble machine learning technique in which an ensemble of weak learners are created. In simpler words, the algorithm combines several smaller, simpler models in order to obtain a more accurate prediction than what …
Random Forest Classifier – Sklearn Python Example
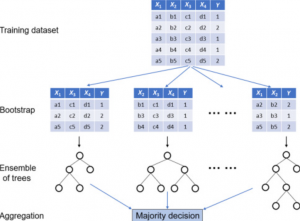
Last updated: 14th Aug, 2024 A random forest classifier is an ensemble machine learning model which is used for classification problems, and operates by constructing a multitude of decision trees during training, and, predicting the class label (of the data). In general, Random Forest is popular due to its high accuracy, robustness to overfitting, ability to handle large datasets with numerous features, and its effectiveness for both classification and regression tasks. Random Forest and Decision Tree classification algorithms are different, although Random Forest is built upon the concept of Decision Trees. In this post, you will learn about the concepts of random forest classifiers and how to train a Random …
Decision Tree Regression vs Linear Regression: Differences
When it comes to building a regression model, one comes across the question such as whether to train the regression model using DecisionTree Regressor algorithm or linear regression algorithm? The following is the key differences you need to know in order to decide which algorithm is the most suitable one, and, why and when one can use one over the other? Linear vs Non-Linear Dataset: Which Algorithm to Use? Linear regression algorithm can be used when there exists linear relationship between the response and predictor variables in the given data set. For two or three dimensional datasets, it is as easy as draw scatter plot and find about the said …
Parametric vs Non-Parametric Models: Differences, Examples
Last updated: 11 Aug, 2024 When working with machine learning models, data scientists often come across a fundamental question: What sets parametric and non-parametric models apart? What are the key differences between these two different classes of models? What needs to be done when working on these models? This is also one of the most frequent questions asked in the interviews. Machine learning models can be parametric or non-parametric. Parametric models are those that require the specification of some parameters before they can be used to make predictions, while non-parametric models do not rely on any specific parameter settings and therefore often produce more accurate results. These two distinct approaches …
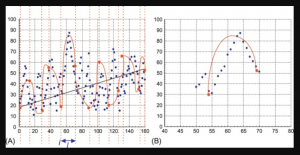
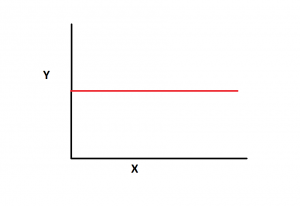
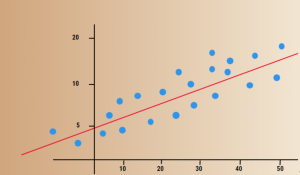
How to know if Linear Regression Model is Appropriate?
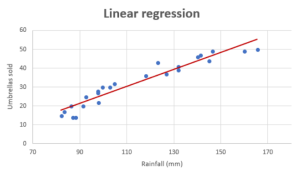
If you want to build a model for predicting a numerical value and wondering whether the linear regression model is most appropriate or valid, then creating the regression scatter plot is the most efficient way. And, this works best if the data set is two or three-dimensional. If a dataset is two-dimensional, it’s simple enough to plot the data to determine its shape. You can plot three-dimensional data too. The objective is to find whether the data set is relatively linear. When the plot is created, the data points fall roughly along a straight line as shown below. Whether Linear Regression Appropriate for High-dimension Datasets? The challenge comes when we …
Lasso Regression in Machine Learning: Python Example

Last updated: 10th Aug, 2024 Lasso regression, sometimes referred to as L1 regularization, is a technique in linear regression that incorporates regularization to curb overfitting and enhance the performance of machine learning models. It works by adding a penalty term to the cost function that encourages the model to select only the most important features and set the coefficients of less important features to zero. This makes Lasso regression a popular method for feature selection and high-dimensional data analysis. In this post, you will learn concepts, formulas, advantages, and limitations of Lasso regression along with Python Sklearn examples. The other two similar forms of regularized linear regression are Ridge regression and …
Pricing Analytics in Banking: Strategies, Examples
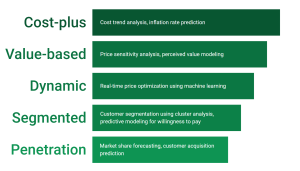
Last updated: 15th May, 2024 Have you ever wondered how your bank decides what to charge you for its services? Or, perhaps how do banks arrive at the pricing (fees, rates, and charges) associated with various banking products? If you’re a product manager, data analyst, or data scientist in the banking industry, you might be aware that these pricing decisions are far from arbitrary. Rather, these pricing decisions are made based on one or more frameworks while leveraging data analytics. They result from intricate pricing strategies, driven by an extensive array of data and sophisticated analytics. In this blog, we will learn about some popular pricing strategies banks execute to …
How to Choose Right Statistical Tests: Examples
Last updated: 13th May, 2024 Whether you are a researcher, data analyst, or data scientist, selecting the appropriate statistical test is crucial for accurate and reliable hypothesis testing for validating any given claim. With numerous tests available, it can be overwhelming to determine the right statistical test for your research question and data type. In this blog, the aim is to simplify the process, providing you with a systematic approach to choosing the right statistical test. This blog will be particularly helpful for those new to statistical analysis and unsure which test to use for their specific needs. You will learn a clear and structured method for selecting the appropriate …
Machine Learning Lifecycle: Data to Deployment Example
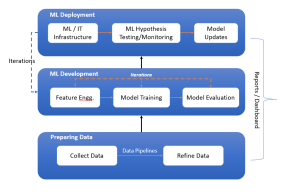
Last updated: 12th May 2024 In this blog, we get an overview of the machine learning lifecycle, from initial data handling to the deployment and iterative improvement of ML models. You might want to check out this book for greater insights into machine learning (ML) concepts – Machine Learning Interviews. The following is the diagram representing the machine learning lifecycle while showcasing three key stages such as preparing data, ML development, and ML deployment. These three stages are explained later in this blog. Stage A: Preparing Data Preparing data for training machine learning models involves collecting data, constructing data pipelines for preprocessing, and refining the data to prepare it for …
Linear Regression T-test: Formula, Example
Last updated: 7th May, 2024 Linear regression is a popular statistical method used to model the relationship between a dependent variable and one or more independent variables. In linear regression, the t-test is a statistical hypothesis testing technique used to test the hypothesis related to the linearity of the relationship between the response variable and different predictor variables. In this blog, we will discuss linear regression and t-test and related formulas and examples. For a detailed read on linear regression, check out my related blog – Linear regression explained with real-life examples. T-tests are used in linear regression to determine if a particular independent variable (or feature) is statistically significant …
Feature Selection vs Feature Extraction: Machine Learning

Last updated: 2nd May, 2024 The success of machine learning models often depends on the quality of the features used to train them. This is where the concepts of feature extraction and feature selection come in. In this blog post, we’ll explore the difference between feature selection and feature extraction, two key techniques used as part of feature engineering in machine learning to optimize feature sets for better model performance. Both feature selection and feature extraction are used for dimensionality reduction which is key to reducing model complexity given that higher model complexity often results in overfitting. We’ll provide examples of how they can be applied in real-world scenarios. If …
Bias-Variance Trade-off in Machine Learning: Examples
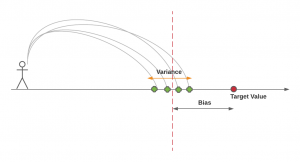
Last updated: 1st May, 2024 The bias-variance trade-off is a fundamental concept in machine learning that presents a challenging dilemma for data scientists. It relates to the problem of simultaneously minimizing two sources of residual error that prevent supervised learning algorithms from generalizing beyond their training data. These two sources of error are related to Bias and Variance. Bias-related errors refer to the error due to overly simplistic machine learning models. Variance-related errors refer to the error due to too much complexity in the models. In this post, you will learn about the concepts of bias & variance in the machine learning (ML) models. You will learn about the tradeoff between bias …
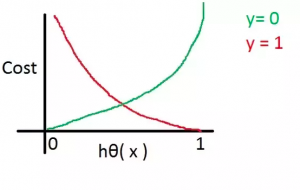
Mean Squared Error vs Cross Entropy Loss Function
Last updated: 1st May, 2024 As a data scientist, understanding the nuances of various cost functions is critical for building high-performance machine learning models. Choosing the right cost function can significantly impact the performance of your model and determine how well it generalizes to unseen data. In this blog post, we will delve into two widely used cost functions: Mean Squared Error (MSE) and Cross Entropy Loss. By comparing their properties, applications, and trade-offs, we aim to provide you with a solid foundation for selecting the most suitable loss function for your specific problem. Cost functions play a pivotal role in training machine learning models as they quantify the difference …
Cross Entropy Loss Explained with Python Examples
Last updated: 1st May, 2024 In this post, you will learn the concepts related to the cross-entropy loss function along with Python code examples and which machine learning algorithms use the cross-entropy loss function as an objective function for training the models. Cross-entropy loss represents a loss function for models that predict the probability value as output (probability distribution as output). Logistic regression is one such algorithm whose output is a probability distribution. You may want to check out the details on how cross-entropy loss is related to information theory and entropy concepts – Information theory & machine learning: Concepts What’s Cross-Entropy Loss? Cross-entropy loss, also known as negative log-likelihood …
I found it very helpful. However the differences are not too understandable for me