Last updated: 7th May, 2024
Linear regression is a popular statistical method used to model the relationship between a dependent variable and one or more independent variables. In linear regression, the t-test is a statistical hypothesis testing technique used to test the hypothesis related to the linearity of the relationship between the response variable and different predictor variables. In this blog, we will discuss linear regression and t-test and related formulas and examples. For a detailed read on linear regression, check out my related blog – Linear regression explained with real-life examples.
T-tests are used in linear regression to determine if a particular independent variable (or feature) is statistically significant in the model. A statistically significant variable has a strong relationship with the dependent variable and contributes significantly to the model’s accuracy.
In the following sections, we will explain the formula for t-tests in linear regression and provide examples (Python, R) of how t-tests are used in linear regression models. We will also explain how to interpret t-test results and provide best practices for using t-tests effectively in linear regression analysis. By understanding how t-tests are used in linear regression analysis, data scientists can gain valuable insights into the relationships between variables and develop more accurate and reliable predictive models.
What is Linear Regression?
Linear regression can be defined as a linear relationship between the response variable and one or more predictor variables. In other words, it is a statistical technique used to determine if there is a linear correlation between the response and predictor variables. A linear regression model is represented using a linear regression mathematical equation. It can also be called the statistical linear model. For a detailed understanding of different aspects of linear regression models, check out my article – Linear Regression Explained with Real-life Examples
The simple linear regression line can be represented by the equation such as the following:
Y=mX+b
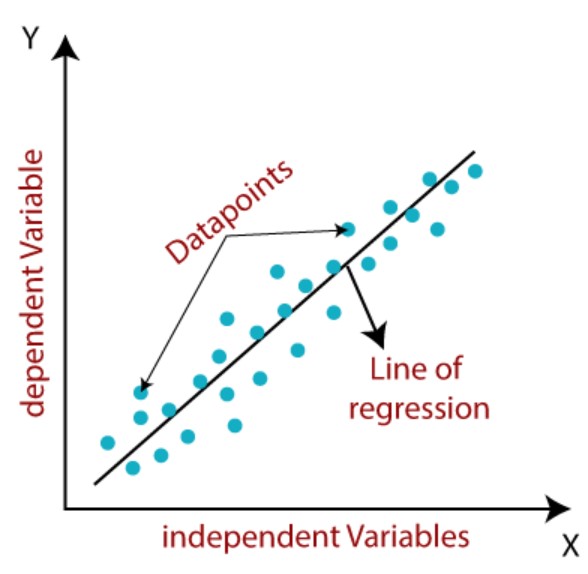
Where Y represents the response variable or dependent variable, X represents the predictor variable or independent variable, m represents the linear slope and b represents the linear intercept. The linear slope, m, can also be termed as the coefficient of the predictor variable. The diagram below represents the linear regression line, dependent (response) and independent (predictor) variables.
Linear regression is of two different types such as the following:
- Simple linear regression: Simple linear regression is defined as linear regression with a single predictor variable. An example of a simple linear regression is Y = mX + b.
- Multiple linear regression: Multiple linear regression is defined as linear regression with more than one predictor variable along with its coefficients. An example of multiple linear regression is Y = aX + bZ + cX*Z.
The question that arises is which of the feature or features in linear regression model is the most appropriate feature. This is where the t-test comes into the picture. T-test allows calculation of t-score or t-value or t-statistics for each of the features of the linear regression models and based on the p-value, one or more features get selected or otherwise. Let’s learn more in the next section.
Concepts, Formula for T-statistics and T-test in Linear Regression
When creating a linear regression model, you can come up with multiple different features or independent variables. However, having multiple features will only make the model very complex. Thus, it becomes important to select the most appropriate features while making the model faster to evaluate, easy to interpret and reduced collinearity. This is where the hypothesis tests such as t-test comes into picture where we calculate t-statistics.
The appropriateness of the linear relationship can be determined by calculating the t-statistic for every regression features while performing t-test. The t-statistic in regression models helps to determine whether the feature is a suitable feature.
The t-test helps in testing whether the coefficients in a regression model are significantly different from zero, indicating that the corresponding predictors have a meaningful contribution to the model. (Lan et al., 2016)
Let’s look at the hypothesis formulation in relation to determining the relationship between dependent and independent variables and how the value that coefficients take to quantify the relationship.
-
Null Hypothesis (H₀): The null hypothesis states that there is no relationship between the feature (independent / predictor variable) and the dependent / response variable. In terms of regression coefficients, it suggests that the coefficient of the feature is equal to zero.
-
Alternative Hypothesis (H₁): The alternative hypothesis contradicts the null hypothesis and suggests that there is not enough evidence in place to suggest that there is no relationship between the feature and the dependent variable. This does imply that there is some relationship. It implies that the coefficient of the feature is not equal to zero.
Going by the above, in a simple linear regression model such as Y = mX + b, the t-test can be used to evaluate the value of coefficient, m, based on the following hypothesis:
- H0: m = 0
- Ha: m ≠ 0
H0: There is no relationship between Y (response variable) and X (predictor variable)
Ha: There is a relationship between Y and X.
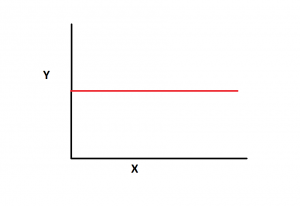
Assuming that the null hypothesis (H0) is true, the linear regression line will be parallel to X-axis such as the following, given Y-axis represents the response variable and the X-axis represent the predictor variable. The following diagram represents the null hypothesis:

The t-test is performed as a hypothesis test to assess the significance of regression coefficients (or features) in the linear regression model. In this case, t-test will be performed to assess the significance of the value, m.
The following is the formula for how to calculate the t-statistic in linear regression. The t-statistic measures the number of standard errors the estimated coefficient is away from the hypothesized value.
t = (β – 0) / SE(β)
where:
- t is the t-statistic
- β is the estimated coefficient of the feature. If there are multiple features, we will have values such as β1, β2, β3, …, βn. That way, we will have t-statistics for each of the coefficients.
- 0 is the hypothesized value (usually zero under the null hypothesis)
- SE(β) is the standard error of the estimated coefficient. Recall that the standard error measures the spread or dispersion of the sampling distribution of a statistic, most commonly of the mean. It’s calculated as:
$ \text{SE} = \frac{s}{\sqrt{n}} $
Where s is the sample standard deviation and n is the sample size. The standard error in the t-statistic formula represents the uncertainty or variability of the sample mean as an estimate of the population mean. It accounts for how much the sample mean would vary if different samples were taken from the same population. A larger absolute value of the t-statistic indicates a greater deviation of the sample mean from the population mean, considering the variability of the sample (expressed by the standard error). Note that the standard error also plays a key role in constructing confidence intervals for estimating population parameters. The t-distribution is often used to determine the margin of error when constructing confidence intervals for small sample sizes.
In linear regression, we estimate the coefficients (such as β1, β2, β3, …, βn) of the features (such as x1, x2, x3, …, xn) using methods like ordinary least squares (OLS). The t-test is then applied to examine the statistical significance of these coefficients. It compares the estimated coefficient to its standard error (as shown above) to determine if the coefficient is significantly different from zero. The standard error measures the variability in the estimated coefficients. Standard errors quantify the uncertainty associated with the coefficient estimates.
The formula for calculating t-statistic (or t-stat) in simple linear regression is as follows:
t = (m – m0) / SE
Where:
t is the t-test statistic
m is the linear slope or the coefficient value obtained using the least square method; For multi-variate regression models, it represents the coefficient estimate for the variable.
m0 is the hypothesized value of linear slope or the coefficient of the predictor variable. The value of m0 = 0.
SE represents the standard error of the coefficient estimate which can be represented using the following formula:
SE = S / √N
Where S represents the standard deviation and N represents the total number of data points.
The standard error (SE) of the coefficient estimate is a measure of the variability in the coefficient estimate. It quantifies the average amount of variation in the estimated coefficient. It considers the variability of the data, the complexity of the model (as reflected by the number of features), and the estimated variance of the error term.
The degree of freedom for t-statistics will be N-2 where N is number of data points.
The t-statistic is compared to a critical value from the t-distribution based on the degrees of freedom and a chosen significance level (commonly 0.05). If the absolute value of the t-statistic exceeds the critical or threshold value, it indicates that the relationship between the predictor variable and the dependent variable is statistically significant. In other words, if the t-statistic is greater than the threshold value, we can reject the null hypothesis and conclude that the variable is statistically significant in the model. Conversely, if the t-statistic is less than the threshold value, we cannot reject the null hypothesis and conclude that the variable is not statistically significant in the model.
Alternatively, based on the value of t-statistics, one can also calculate the p-value and compare with the level of significance (0.05). If the p-value less than 0.05 indicates that the outcome of t-test is statistically significant and you can reject the null hypothesis that there is no relationship between Y and X (m=0). This means that the value of m calculated holds good.
When the number of variables is small as in simple linear regression model, an exhaustive search amongst all features can be performed. However, as the number of features or independent variables increases, the hypothesis space grows exponentially and heuristic search procedures can be needed. Using the p-values, the variable space can be navigated in the following three possible ways.
- Forward regression starts from the empty model and always adds variables based on low p-values.
- Backward regression starts from the full model and always removes variables based on high p-values.
- Stepwise regression is a combination of both. It starts off like forward regression, but once the second variable has been added, it will always check the other variables in the model and remove them if they turn out to be insignificant according to their p-value
How to interpret t-statistics or t-value in regression models?
Interpreting the t-statistic in regression involves assessing the significance of regression coefficients for each parameter of the regression model. Here’s a basic guideline:
- Magnitude and Sign: The magnitude of the t-statistic indicates the strength of evidence against the null hypothesis (typically, the coefficient is zero, meaning no effect). A higher absolute value of the t-statistic suggests stronger evidence. The sign indicates the direction of the relationship.
- Threshold or Critical Value: Compare the t-statistic to a critical value from the t-distribution, which depends on the desired level of significance (commonly 0.05 for a 95% confidence level) and the degrees of freedom. If the absolute value of the t-statistic is greater than the critical value, the coefficient is considered statistically significant, and the null hypothesis can be rejected. There are several online t-distribution tables that can be used to determine critical t-values for both one-tailed and two-tailed tests. Here is one of them: T-Distribution Table of Critical Values.
- P-Value Association: The t-statistic is associated with a p-value, which helps in determining significance. If the p-value is less than the chosen significance level (e.g., 0.05), the coefficient is statistically significant. This means there is sufficient evidence to suggest that the coefficient is different from zero. The null hypothesis can thus be rejected. There are several online t-statistics / p-value calculator for finding p-value from t-statistics value. Here is one of them: P-value from T-statistics – Calculator
In summary, a higher absolute t-statistic and a p-value lower than the significance threshold generally indicate that the variable is significantly contributing to the model.
Python Example of T-Tests in Linear Regression
T-tests are a powerful tool for determining the significance of individual variables in linear regression models. Here are some examples of scenarios where t-tests are commonly used in linear regression analysis:
- Testing the Significance of Regression Coefficients: In linear regression, we estimate a coefficient for each independent variable to determine its relationship with the dependent variable. A t-test can be used to determine if the coefficient estimate is statistically significant. For example, consider a linear regression model that predicts the price of a house based on its size and the number of bedrooms. We can use a t-test to determine if the coefficient estimate for the size variable is statistically significant, indicating that house size has a significant impact on the price.
- Comparing the Significance of Different Variables: T-tests can also be used to compare the significance of different variables in the model. For example, consider a linear regression model that predicts a student’s GPA based on their SAT scores and high school GPA. We can use a t-test to determine if the coefficient estimate for the SAT score variable is statistically different from the coefficient estimate for the high school GPA variable, indicating which variable is more significant in predicting the student’s GPA.
Here’s how you can perform t-tests in linear regression using Python:
import statsmodels.api as sm
# Load the dataset
data = sm.datasets.get_rdataset('cars', 'datasets').data
# Fit the linear regression model
model = sm.formula.ols('dist ~ speed', data=data).fit()
# Print the t-test results
print(model.summary())
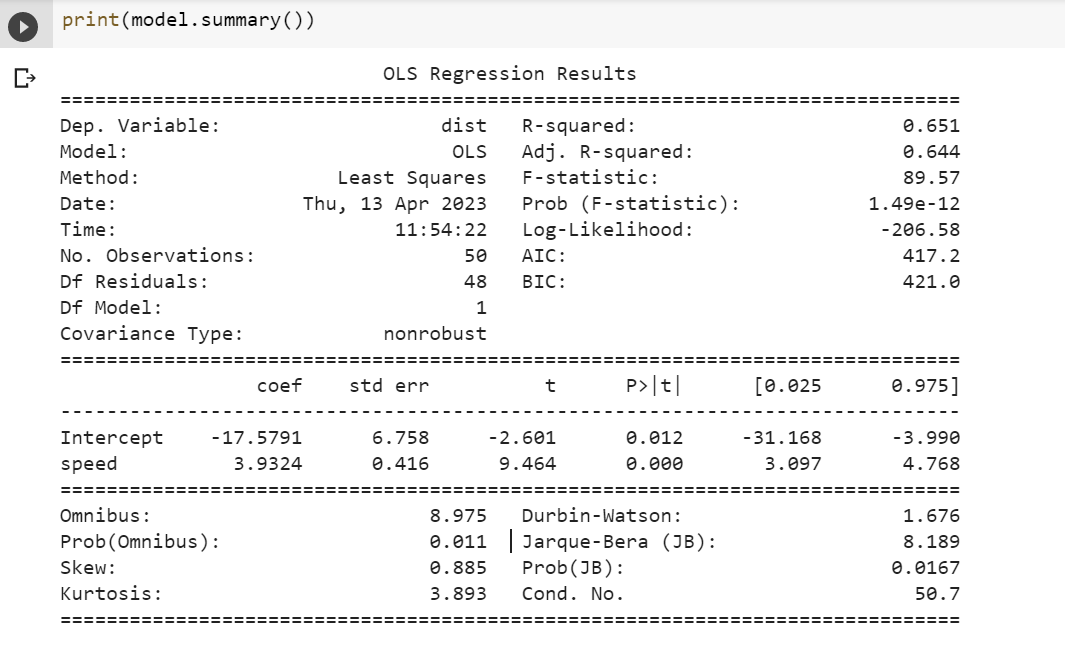
In the example above, we load the “cars” dataset from the “statsmodels” package and fit a linear regression model to predict the stopping distance of a car based on its speed. We then print the t-test results using the summary() method, which includes the coefficient estimates, standard errors, t-values, and p-values for each variable in the model.
R Example of T-Tests in Linear Regression
We will fit a simple linear regression model using Cars data available in R. We will follow the following steps to fit and evaluate the model.
- Load the cars dataset: This dataset comes pre-loaded in R and contains two variables: speed (the speed of cars) and dist (the distances taken to stop).
- Fit a linear regression model: We’ll use the lm function in R to fit a linear model with dist as the dependent variable and speed as the independent variable.
- Print the model summary: We’ll use the summary function to get detailed information about the model, including coefficients, standard errors, t-values, and the R-squared value.
- Interpreting Key Parameters:
- Coefficients: Indicate the estimated change in the dependent variable for a one-unit change in the predictor.
- Standard Error: Measures the accuracy of the coefficients.
- t-value: Helps in testing the hypothesis that a coefficient is different from zero (i.e., it has a significant effect).
- p-value: Indicates the probability of observing the data if the null hypothesis is true. A low p-value (< 0.05) typically indicates that the predictor is significant.
- R-squared: Measures the proportion of variance in the dependent variable that is predictable from the independent variable.
# Load the 'cars' dataset data(cars) # Fit the linear regression model model &amp;amp;lt;- lm(dist ~ speed, data = cars) # Print the summary of the model summary(model)
This is what will get printed.
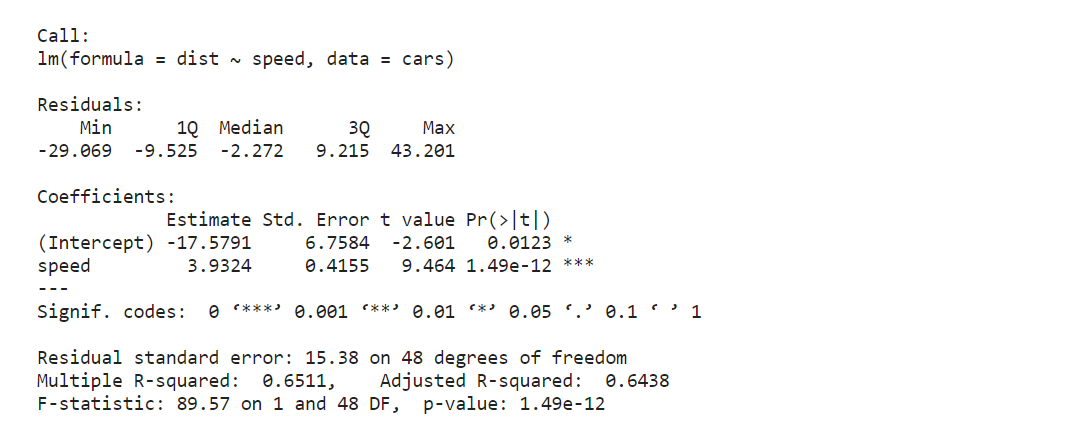
Here is the conclusion we can arrive based on the above output:
Based on the output of the linear regression model you’ve run on the cars dataset, we can draw conclusions about the speed parameter by considering its standard error, t-value, and p-value (Pr(>|t|)):
- Estimate (Coefficient): The coefficient for speed is 3.9324. This means that for each additional unit of speed, the stopping distance (dist) increases by approximately 3.9324 units, assuming all other factors remain constant.
- Standard Error: The standard error of the estimate for speed is 0.4155. This measures the accuracy of the coefficient (3.9324) estimate and indicates a relatively low level of uncertainty or variability in the estimate of the effect of speed on dist.
- t-value: The t-value for speed is 9.464. This value is used to test the null hypothesis that the coefficient (effect of speed on dist ) is zero. A larger absolute t-value indicates a greater deviation of the coefficient from zero, suggesting that it is highly unlikely to observe such a large t-value if the true coefficient were zero.
- p-value (Pr(>|t|)): The p-value for speed is extremely small (1.49e-12), which is far below any standard significance level (like 0.05 or 0.01). This indicates that the effect of speed on dist is statistically significant, meaning that there is a very low probability that the observed relationship between speed and dist in the sample occurred by random chance.
Given the large t-value and the extremely small p-value, we can confidently reject the null hypothesis that speed has no effect on dist. The positive coefficient indicates that as speed increases, the stopping distance (dist) also increases. This relationship is statistically significant, and the relatively small standard error suggests that the estimate of this effect is precise. Therefore, we can conclude that speed is a significant predictor of stopping distance in the cars dataset.
Frequently Asked Questions (FAQs)
The following are some of the FAQs in relation to linear regression and t-test:
- Is t-test and linear regression one and same? Is there a difference?
- No. Linear regression and t-test are not one and same. They are completely different. T-test is used to measure appropriateness of features in linear regression models.
- What’s the use of t-statistics or t-value or t in linear regression? What does t-stat mean in regression?
- T-statistics is calculated for each feature and related p-value is calculated to reject a feature or otherwise. T-statistics is also called as t-value, t-score.
- How is t-statistics and p-value used in regression analysis?
- In regression analysis, t-statistics evaluate the significance of regression coefficients, indicating if a variable significantly contributes to the model. P-values, derived from t-statistics, show the probability that the coefficient is actually zero, helping to determine if the variable’s effect is statistically significant.
- What is a “good” t-statistics or t-stat in regression analysis?
- In regression, a “good” t-statistic or t-value is one that is significantly higher in absolute value than the critical value from the t-distribution for a chosen significance level, typically around 2 or -2 for a 95% confidence level. This indicates that the coefficient is likely statistically significant.
- Is linear regression a statistical test?
- Linear regression is not a statistical test but rather a statistical method used to model relationships between variables. Within it, statistical tests like T-tests assess the significance of individual predictors, determining their impact on the dependent variable. The F-test evaluates the overall significance of the model, checking if any predictors are meaningful. These tests, integral to linear regression, help in validating the strength and relevance of the model by examining the importance of individual variables and the model as a whole.
- What does zero slope mean in the relationship between variables?
- A relationship with a zero slope indicates no correlation between the variables: the dependent variable remains constant despite changes in the independent variable. Graphically, this is a horizontal line, showing that variations in one variable do not affect the other, exemplifying a lack of relationship.
- When is t-test not applicable for linear regression models?
- In cases where the number of predictors exceeds the number of observations (high-dimensional data), traditional t-tests may not be applicable. Alternative methods like the Correlated Predictors Screening (CPS) have been developed to handle such scenarios, allowing for the effective estimation and testing of regression coefficients (Lan et al., 2016)
- When assumptions such as the normality of errors are violated, alternative methods to the t-test, like permutation tests, are proposed to maintain the reliability of significance testing in linear regression models (Ryu et al., 2013)
Conclusion
In this blog post, we have explored the formula for t-tests in linear regression, provided examples of when t-tests are used in linear regression models, and explained how to interpret t-test results.
We have learned that t-tests are a powerful tool for determining the significance of individual variables in linear regression models. By performing t-tests, data scientists can identify which variables are most important for predicting the dependent variable and gain valuable insights into the relationships between variables.
By following best practices for using t-tests in linear regression analysis, data scientists can develop more accurate and reliable predictive models and make better-informed decisions. It is recommend that data scientists use t-tests as a standard tool in their linear regression analysis, but with careful consideration of the underlying assumptions and practical implications. By doing so, they can achieve more accurate and reliable results and gain valuable insights into the complex relationships between variables in their datasets.

Check out my latest book titled as First Principles Thinking: Building winning products using first principles thinking.
- Mathematics Topics for Machine Learning Beginners - July 6, 2025
- Questions to Ask When Thinking Like a Product Leader - July 3, 2025
- Three Approaches to Creating AI Agents: Code Examples - June 27, 2025
I’m in love with your discussion. I want collaboration with this blogger.