Last updated: 13th May, 2024
Whether you are a researcher, data analyst, or data scientist, selecting the appropriate statistical test is crucial for accurate and reliable hypothesis testing for validating any given claim. With numerous tests available, it can be overwhelming to determine the right statistical test for your research question and data type. In this blog, the aim is to simplify the process, providing you with a systematic approach to choosing the right statistical test. This blog will be particularly helpful for those new to statistical analysis and unsure which test to use for their specific needs. You will learn a clear and structured method for selecting the appropriate statistical test. By considering factors such as data type, comparison type, assumptions, and sample size, you will be able to confidently choose the right test to analyze your data accurately.
Step 1: Define the Research Question; Identify the Data Type
The first step is to begin by clearly stating the research question or objective. Next, determine the type of data you are working with. Categorical data involves classifying observations into groups or categories, while continuous data represents values that can take on any numerical value within a range.
For example, let’s say the research question is the following:
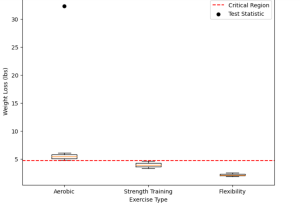
Does the type of exercise (aerobic, strength training, or flexibility) have an impact on weight loss?
Note that the above research question focuses on the relationship between different types of exercise and weight loss. To proceed with selecting the appropriate statistical test, we need to identify the type of data involved.
The data in this scenario would likely involve categorical data for the type of exercise and continuous data for weight loss measurements. The type of exercise can be categorized as aerobic, strength training, or flexibility, representing distinct groups or categories. On the other hand, weight loss measurements would involve numerical values within a range, making it a continuous data type.
Here is how the sample data would look like:
| Participant | Exercise Type | Weight Loss (in lbs) |
|---|---|---|
| 1 | Aerobic | 5.2 |
| 2 | Strength Training | 3.9 |
| 3 | Flexibility | 2.5 |
| 4 | Aerobic | 6.1 |
| 5 | Aerobic | 4.8 |
| 6 | Strength Training | 3.3 |
| 7 | Flexibility | 1.9 |
| 8 | Strength Training | 4.6 |
| 9 | Aerobic | 5.7 |
| 10 | Flexibility | 2.1 |
Step 2: Formulate the Hypothesis
To conduct a statistical test, it is essential to formulate a hypothesis. The null hypothesis (H₀) states that there is no effect or difference in the population, while the alternative hypothesis (H₁ or Ha) suggests the presence of an effect or difference.
Extending the example in the previous section, here is how the hypothesis formulation would look like.
Null Hypothesis (H₀): There is no significant difference in weight loss among different exercise types. In other words, the type of exercise has no effect on weight loss.
Alternative Hypothesis (H₁ or Ha): There is a significant difference in weight loss among different exercise types. In other words, the type of exercise does have an effect on weight loss.
To summarize:
H₀: The mean weight loss is the same for all exercise types.
H₁: The mean weight loss differs among exercise types.
By formulating these hypotheses, we establish the basis for conducting statistical tests and evaluating whether the data provides evidence to support or reject the null hypothesis in favor of the alternative hypothesis.
Step 3: Identify the Type of Comparison
Based on the research question, we need to determine the type of comparison that need to be made. There are three main types:
- One-sample: This type of comparison involves comparing a sample mean or proportion to a known value or population. For example, if we wanted to compare the average weight loss in our dataset discussed in earlier section to a known target weight loss value, we would use a one-sample comparison.
- Independent samples: This type of comparison involves comparing two or more groups that are unrelated or independent. In our exercise example, we may compare weight loss between different exercise types, such as aerobic, strength training, and flexibility. Each exercise type represents an independent group, and we want to determine if there are significant differences in weight loss between these groups.
- Paired samples: This type of comparison involves comparing two related groups or measurements. In our exercise example, we could measure weight loss before and after a specific exercise program for the same individuals. By comparing the weight loss values for each participant before and after the exercise program, we can assess the effectiveness of the program for each individual.
Based on the example (H₀: The mean weight loss is the same for all exercise types), the type of comparison we are interested in is an independent samples comparison. We want to compare weight loss measurements between the different exercise types (aerobic, strength training, and flexibility) to determine if there are significant differences in weight loss based on the type of exercise performed.
Identifying the appropriate type of comparison is essential as it guides us in selecting the correct statistical test that suits our research question and data type. In the next step, we will consider the number of groups or variables being compared, further narrowing down our choice of statistical tests.
Step 4: Determine the No. of Groups or Variables being Compared
Consider the number of groups or variables involved in our analysis. If we are comparing one or two groups/variables, it falls into the one-sample or two-sample category. If we have three or more groups/variables, we will need to choose tests designed for such comparisons.
In the exercise vs. weight loss example, we need to determine the number of groups or variables we are comparing. This step helps us choose the appropriate statistical test that accommodates the specific comparison scenario.
In our example, we are comparing weight loss measurements among different exercise types (aerobic, strength training, and flexibility). Therefore, we have three groups: aerobic exercise group, strength training exercise group, and flexibility exercise group.
Since we have more than two groups, this falls under the category of comparing three or more groups. It is important to identify the number of groups accurately because different statistical tests are designed to handle specific scenarios. Knowing that we have three groups will guide us in selecting the appropriate test for our analysis.
Step 5: Consider the Assumptions & Requirements of the Test
Different statistical tests have specific assumptions and requirements. Some common considerations include:
- Normality: Assess whether your data are normally distributed or can be transformed to approximate normality.
- Independence: Determine if your observations are independent.
- Homogeneity of variances: Check if the variances are approximately equal across groups.
- Sample size: Verify if our sample sizes are sufficient for the chosen test.
In the exercise vs. weight loss example, it is important to consider the assumptions and requirements of the statistical test we choose. Different tests have specific assumptions that need to be met for accurate and reliable results. Here are some common considerations:
- Normality: Many statistical tests assume that the data follow a normal distribution. In our example, we would need to assess if the weight loss measurements within each exercise type group are approximately normally distributed. This can be done through visual inspection or statistical tests such as the Shapiro-Wilk test or the Kolmogorov-Smirnov test.
- Independence: It is generally assumed that observations within each group are independent of each other. In our example, each participant’s weight loss measurement is independent of the others if the participants were assigned to exercise types randomly or if the exercise groups are unrelated.
- Homogeneity of variances: Some statistical tests, such as analysis of variance (ANOVA), assume that the variances of the dependent variable (weight loss) are approximately equal across different exercise type groups. This assumption can be assessed using statistical tests like Levene’s test or by examining graphical representations, such as boxplots.
- Sample size: The chosen statistical test may have requirements regarding the minimum sample size for accurate results. Ensuring that each exercise type group has a sufficient number of observations can help meet these requirements.
Step 6: Select the Appropriate Statistical Test
Based on the previous steps and considerations, choose the most suitable statistical test for our data analysis. Here are some commonly used tests:
- Categorical data:
- Chi-square test
- Fisher’s exact test
- McNemar’s test
- Continuous data:
- One-sample t-test
- Independent samples t-test
- Paired samples t-test
- Analysis of variance (ANOVA)
- Kruskal-Wallis test
- Mann-Whitney U test / Wilcoxon Rank Sum Test
- Wilcoxon signed-rank test
- Correlation analysis
- Regression analysis
In the exercise vs. weight loss example, we have determined that we are conducting an independent samples comparison, comparing weight loss measurements among different exercise types (aerobic, strength training, and flexibility). We have also considered the assumptions and requirements of the test.
Based on these considerations, we can select the appropriate statistical test. Here are some commonly used tests for independent samples comparisons:
- Analysis of Variance (ANOVA): ANOVA is used to compare the means of three or more independent groups. In our example, if we have more than two exercise types (e.g., aerobic, strength training, flexibility), ANOVA can be employed to assess if there are significant differences in weight loss among these groups.
- Kruskal-Wallis test: If the assumption of normality is not met or the variances are not equal across exercise type groups, the Kruskal-Wallis test can be used instead of ANOVA. The Kruskal-Wallis test compares the medians of three or more independent groups.
- Mann-Whitney U test: If we are comparing two independent groups instead of three or more, such as aerobic exercise vs. strength training, the Mann-Whitney U test can be employed. This test compares the medians of two independent groups when the assumptions for ANOVA are not met.
Selecting the appropriate test depends on the specific characteristics of the data and the research question. It is crucial to choose the test that best aligns with the comparison scenario and meets the assumptions and requirements of the data.
Step 7: Perform the Hypothesis test & Interpret Results
Once we have selected the appropriate test, we will perform the statistical analysis using the data we collected and the chosen test. As a result, we will calculate the test statistic and p-value. With a predetermined level of significance (alpha), typically 0.05 or 0.01, set, the obtained p-value will be compared to the level of significance. If the p-value is less than or equal to alpha, we will reject the null hypothesis and consider the alternative hypothesis. Conversely, if the p-value is greater than alpha, fail to reject the null hypothesis due to insufficient evidence.
Lets see a sample Python code for step 6 and step 7 assuming the assumptions of one-way ANOVA test (such as normality and homogeneity of variances) are met. The data used is as per the example shared in this post (refer step 1). We are applying one-way ANOVA test because we are comparing the means of three or more independent groups (aerobic, strength training, and flexibility). The one-way ANOVA test is appropriate for this scenario.
import scipy.stats as stats

# Assume we have weight loss data for each exercise type in separate arrays or lists
aerobic = [5.2, 6.1, 4.8, 5.7]
strength_training = [3.9, 3.3, 4.6]
flexibility = [2.5, 1.9, 2.1]

# Perform one-way ANOVA test
statistic, p_value = stats.f_oneway(aerobic, strength_training, flexibility)

# Print the results
print("One-Way ANOVA Results:")
print("Test Statistic:", statistic)
print("p-value:", p_value)

# Interpret the results
alpha = 0.05  # Set the significance level

if p_value < alpha:
    print("There is significant evidence to reject the null hypothesis.")
    print("There are significant differences in weight loss among the exercise types.")
else:
    print("There is insufficient evidence to reject the null hypothesis.")
    print("There are no significant differences in weight loss among the exercise types.")
In the above code, the one-way ANOVA test is performed using the stats.f_oneway() function from the scipy.stats module. The weight loss measurements for each exercise type are assumed to be stored in separate arrays or lists (aerobic, strength_training, and flexibility). The test statistic and p-value are printed, and the results are interpreted based on the chosen significance level (alpha).
Conclusion
In this blog post, the step-by-step instructions were provided on how to choose the right statistical test for your data analysis. By following these key steps, you can ensure accurate and reliable results that align with your research question and data type. Let’s recap the important steps covered:
- Clearly define your research question or objective and identify the type of data you have. Categorical data involves classifying observations into groups or categories, while continuous data represents values that can take on any numerical value within a range.
- Formulate your hypothesis by stating the null hypothesis (H₀) and the alternative hypothesis (H₁ or Ha). This sets the foundation for the hypothesis testing process.
- Identify the type of comparison you are making: one-sample, independent samples, or paired samples. This helps determine the appropriate statistical test for your analysis.
- Determine the number of groups or variables being compared. This narrows down the selection of statistical tests and ensures that you choose the one suitable for your scenario.
- Consider the assumptions and requirements of the test. Assess factors such as normality, independence, homogeneity of variances, and sample size to ensure the chosen test is appropriate for your data.
- Select the appropriate statistical test based on the comparison type, data type, and assumptions. Examples include one-sample t-test, independent samples t-test, ANOVA, or non-parametric tests like the Mann-Whitney U test.
- Perform the hypothesis test using the chosen statistical test. Calculate the test statistic, obtain the p-value, and compare it to the significance level (alpha) to determine the outcome of the test.
By following these steps, you can confidently choose the right statistical test for your data analysis, perform the test accurately, and interpret the results effectively. Remember to consider the specific requirements of your research question and data type when applying these steps.

Check out my latest book titled as First Principles Thinking: Building winning products using first principles thinking.
- Completion Model vs Chat Model: Python Examples - June 30, 2024
- LLM Hosting Strategy, Options & Cost: Examples - June 30, 2024
- Application Architecture for LLM Applications: Examples - June 25, 2024
Leave a Reply