Last updated: 1st May, 2024
In this post, you will learn the concepts related to the cross-entropy loss function along with Python code examples and which machine learning algorithms use the cross-entropy loss function as an objective function for training the models. Cross-entropy loss represents a loss function for models that predict the probability value as output (probability distribution as output). Logistic regression is one such algorithm whose output is a probability distribution. You may want to check out the details on how cross-entropy loss is related to information theory and entropy concepts – Information theory & machine learning: Concepts
What’s Cross-Entropy Loss?
Cross-entropy loss, also known as negative log-likelihood loss, is a commonly used loss function in machine learning for classification problems. The function measures the difference between the target variables’ predicted probability distribution and the true probability distribution. The higher the cross-entropy loss, the greater the need to improve the performance of the model. The lesser the loss, the better the performance of the model.
The optimization objective during the classification model training is to minimize cross-entropy loss by adjusting the model’s parameters. If the class’s predicted probability is way different than the actual class label (0 or 1), the value of cross-entropy loss is high. In case, the predicted probability of the class is near to the class label (0 or 1), the cross-entropy loss will be less.
The following is the formula of the cross entropy function given two different probability distributions, P and Q:
$H(P, Q) = -\sum_{x \in X} P(x) \log(Q(x))$
In the above formula, P can be the actual probability distribution of the target variable, and, Q can be the predicted probability distribution. X represents the random variable and x can be different values of the random variable X. Note that the above formula is applicable for a discrete probability distribution. However, a similar formula of cross entropy can be written for a continuous probability distribution. Check out my video on the concept of cross-entropy loss function.
The cross-entropy loss function is commonly used for the models that have softmax output. Recall that the softmax function is a generalization of logistic regression to multiple dimensions and is used in multinomial logistic regression. Read greater details in one of my related posts – Softmax regression explained with Python example.
Cross-entropy loss is commonly used in machine learning algorithms such as:
- Neural networks, specifically in the output layer calculate the difference between the predicted probability and the true label during training.
- Logistic Regression and Softmax Regression
- Multinomial Logistic Regression and Maximum Entropy Classifier
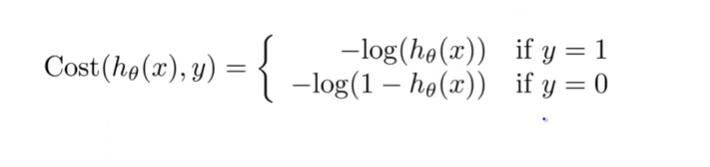
The above formula of cross-entropy cost function can be extended to the logistic regression model. Cross-entropy loss is used as a cost function for logistic regression models to estimate the parameters. Here is what the cost function of logistic regression looks like:
The above cost function can be derived from the original likelihood function which is aimed to be maximized when training a logistic regression model. Here is what the likelihood function looks like:
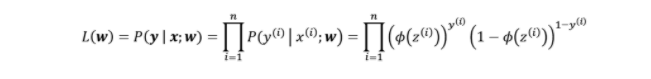
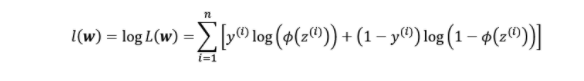
To maximize the above likelihood function, the approach of taking the negative log of the likelihood function (as shown above) and minimizing the function is adopted for mathematical ease. Thus, the cross-entropy loss is also termed log loss. It makes it easy to minimize the negative log-likelihood function because it makes it easy to take the derivative of the resultant summation function after taking the log. Here is what the log of the above likelihood function looks like.
To apply gradient descent to the above log-likelihood function, the negative of the log-likelihood function as shown in Fig 3 is taken. Thus, for y = 0 and y = 1, the cost function becomes the same as the one given in Fig 1.
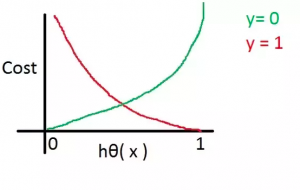
Cross-entropy loss function or log-loss function as shown in fig 1 when plotted against the hypothesis outcome/probability value would look like the following:
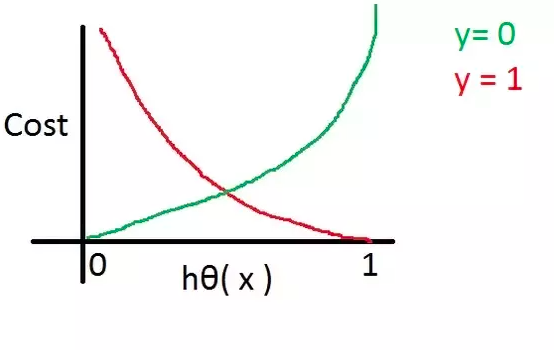
Let’s understand the log loss function in light of the above diagram:
- For the actual label value as 1 (red line), if the hypothesis value is 1, the loss or cost function output will be near zero. However, when the hypothesis value is zero, the cost will be very high (near to infinite).
- For the actual label value as 0 (green line), if the hypothesis value is 1, the loss or cost function output will be near infinite. However, when the hypothesis value is zero, the cost will be very less (near zero).
Based on the above, the gradient descent algorithm can be applied to learn the parameters of the logistic regression models or models using the softmax function as an activation function such as a neural network.
Check out the following to understand the explanation given above in relation to the cost function of the logistic regression model.
Cross-entropy Loss Explained with Python Example
In this section, you will learn about cross-entropy loss using Python code examples. This is the function we will need to represent in form of a Python function.
As per the above function, we need to have two functions, one as a cost function (cross-entropy function) representing the equation in Fig 5, and the other is a hypothesis function that outputs the probability. In this section, the hypothesis function is chosen as the sigmoid function. Here is the Python code for these two functions. Pay attention to sigmoid function (hypothesis) and cross-entropy loss function (cross_entropy_loss)
import numpy as np
import matplotlib.pyplot as plt

'''
Hypothesis Function - Sigmoid function
'''
def sigmoid(z):
    return 1.0 / (1.0 + np.exp(-z))

'''
yHat represents the predicted value / probability value calculated as output of hypothesis / sigmoid function

y represents the actual label
'''
def cross_entropy_loss(yHat, y):
    if y == 1:
      return -np.log(yHat)
    else:
      return -np.log(1 - yHat)
Once we have these two functions, let’s go and create a sample value of Z (weighted sum as in logistic regression) and create the cross-entropy loss function plot showing plots for cost function output vs hypothesis function output (probability value).
#
# Calculate sample values for Z
#
z = np.arange(-10, 10, 0.1)
#
# Calculate the hypothesis value / probability value
#
h_z = sigmoid(z)
#
# Value of cost function when y = 1
# -log(h(x))
#
cost_1 = cross_entropy_loss(h_z, 1)
#
# Value of cost function when y = 0
# -log(1 - h(x))
#
cost_0 = cross_entropy_loss(h_z, 0)
#
# Plot the cross entropy loss
#
fig, ax = plt.subplots(figsize=(8,6))
plt.plot(h_z, cost_1, label='J(w) if y=1')
plt.plot(h_z, cost_0, label='J(w) if y=0')
plt.xlabel('$\phi$(z)')
plt.ylabel('J(w)')
plt.legend(loc='best')
plt.tight_layout()
plt.show()
Here is what the cross-entropy loss / log loss plot would look like:
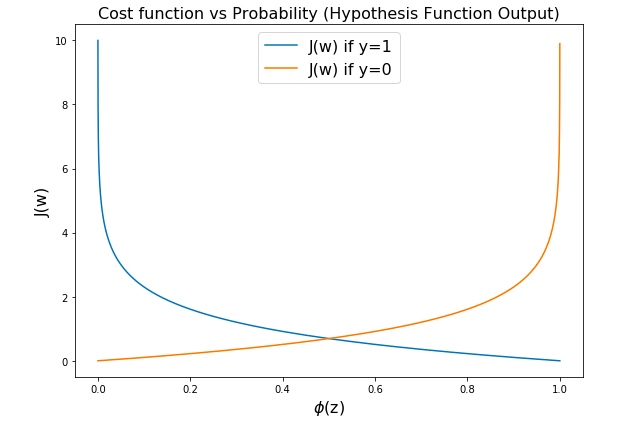
Note some of the following in the above:
- For y = 1, if the predicted probability is near 1, the loss function out, J(W), is close to 0 otherwise it is close to infinity.
- For y = 0, if the predicted probability is near 0, the loss function out, J(W), is close to 0 otherwise it is close to infinity.
Conclusions
Here is the summary of what you learned in relation to the cross-entropy loss function:
- The cross-entropy loss function is used as the cost function to measure the difference between the predicted probability distribution of the target variable vs the true probability distribution.
- The cross-entropy loss is high when the predicted probability is way different than the actual class label (0 or 1).
- The cross-entropy loss is less when the predicted probability is closer or nearer to the actual class label (0 or 1).
- The objective of model training is to minimize the cross entropy loss.
- The cross-entropy loss function is also termed a log loss function when considering logistic regression. This is because the negative of the log-likelihood function is minimized.
- A gradient descent algorithm can be used with a cross-entropy loss function to estimate the model parameters.
Take a Quiz
Results


#1. What is the purpose of cross-entropy loss in machine learning?
#2. What type of problem is cross-entropy loss best suited for?
#3. How does cross-entropy loss compare to mean squared error loss in terms of performance?
#4. What is the relationship between cross-entropy loss and log-likelihood?
#5. How does cross-entropy loss help to prevent overfitting?

Check out my latest book titled as First Principles Thinking: Building winning products using first principles thinking.
- Mathematics Topics for Machine Learning Beginners - July 6, 2025
- Questions to Ask When Thinking Like a Product Leader - July 3, 2025
- Three Approaches to Creating AI Agents: Code Examples - June 27, 2025
Khub upokar holo. DaDa