
Ridge regression is a type of linear regression that penalizes ridge coefficients. This technique can be used to reduce the effects of multicollinearity in ridge regression, which may result from high correlations among predictors or between predictors and independent variables. In this tutorial, we will explain ridge regression with a Python example.
What is Ridge Regression?
Ridge regression is a powerful technique in machine learning that addresses the issue of overfitting in linear models. In linear regression, we aim to model the relationship between a response variable and one or more predictor variables. However, when there are multiple variables that are highly correlated, the model can become too complex and prone to overfitting. This is where ridge regression comes into play.
Let’s consider a real-world example to illustrate this. Imagine you are working on a housing dataset where you want to predict the price of a house based on various features such as size, number of bedrooms, location, and age. In this case, it’s highly likely that some of these features are correlated with each other. For instance, the size of the house and the number of bedrooms might be strongly correlated. This multicollinearity can lead to unstable and unreliable coefficient estimates in a traditional linear regression model.
To combat this, ridge regression introduces a penalty term to the error function, known as the ridge penalty or L2 regularization term. This penalty shrinks the coefficients towards zero, reducing their magnitudes. By adding this penalty, ridge regression prevents the coefficients from becoming too large, effectively reducing the complexity of the model. This helps to mitigate the problem of overfitting by striking a balance between capturing the underlying patterns in the data and avoiding excessive reliance on individual data points.
Returning to our housing example, ridge regression would help in handling multicollinearity. By applying the ridge penalty, the coefficients for the highly correlated features (e.g., size and number of bedrooms) would be penalized, ensuring that the model does not assign too much weight to any one feature. This regularization effect enhances the stability and generalization capability of the model.
Moreover, ridge regression offers some resistance to outliers, which are extreme data points that deviate significantly from the majority of the data. Outliers can have a disproportionate impact on traditional linear regression models, pulling the estimated coefficients towards them and affecting the model’s overall performance. In contrast, ridge regression reduces the sensitivity to outliers by shrinking the coefficients, making the model more robust to these influential data points.
However, it’s important to note that while ridge regression can provide some resilience to outliers, it is not specifically designed to handle them. For datasets with a substantial presence of outliers, other methods such as robust regression techniques or the L1 regularization (used in LASSO regression) might be more appropriate.
How does Ridge Regression work?
Ridge regression works by adding a penalty term to the cost function, the penalty term being proportional to the sum of the squares of the coefficients. The penalty term is called the L2 norm. The result is that the optimization problem becomes easier to solve and the coefficients become smaller. This penalty term encourages the model to find a balance between fitting the training data well and having low complexity. As a result, ridge regression can help to improve the generalizability of a machine learning model.
The cost function for ridge regression looks like this. You may note that the cost function comprises two functions. The first one is the cost function same as the one used for the linear regression model. This term ensures that the training data fits well. The second term is called the L2 penalty or regularization term. The goal of this term is to keep the parameters small.

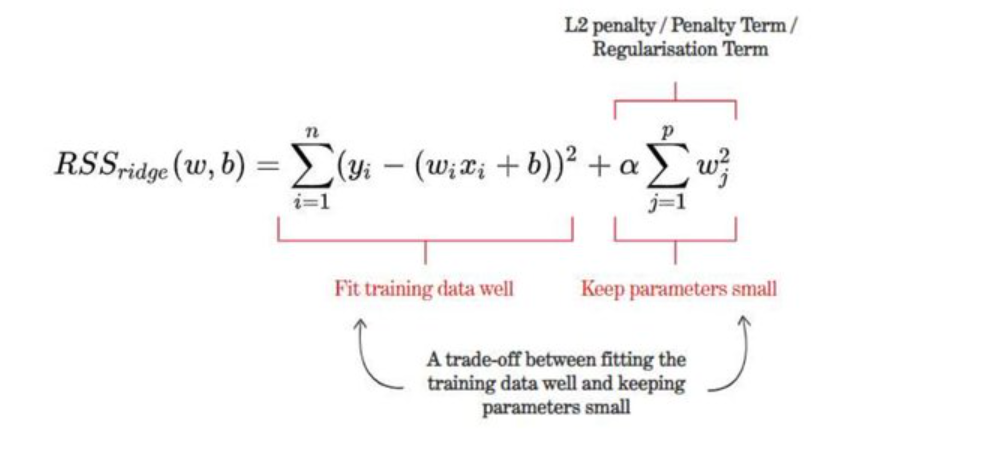
where y is the predicted value, x is the input value, β is the coefficient, and λ is the penalty term. As you can see, the penalty term is added to the error term. In ridge regression, we want to minimize both the error and the size of the coefficients. By adding the penalty term, we are encouraged to find a balance between these two objectives.
Advantages & disadvantages of Ridge Regression
Ridge regression penalizes the sum of the squared coefficients, or beta values, in order to reduce the variance of the estimates. It shrinks the coefficients and thus reduces the standard errors. The penalty term serves to reduce the magnitude of the coefficients, and it also helps to prevent overfitting. As a result, Ridge regression can provide improved predictive accuracy. This ultimately results in more stable and accurate predictions. Ridge regression also has the ability to handle nonlinear relationships between predictor and outcome variables better than linear regression.
Ridge regression has a number of advantages over least squares or linear regression. First, it is more robust to collinearity than least-squares/linear regression. Second, ridge regression does not require the data to be perfectly normalized. Finally, ridge regression can be applied even when the number of variables is greater than the number of observations.
However, ridge regression also has some disadvantages. First, it can be computationally expensive if the data set is large. Second, it can be difficult to interpret the results of ridge regression because the Ridge term or L2 norm modifies the coefficients. This is because the cost function contains a quadratic term, which makes it more difficult to optimize. In addition, ridge regression does not provide an exact solution and instead only provides a closed-form approximation. This can make it difficult to interpret the results of the model. Finally, ridge regression can offer some degree of resistance to outliers due to the regularization effect, but it is not as robust as other dedicated outlier-robust regression techniques.
Ridge Regression Python Example
Python provides a number of Ridge regression implementations, including Ridge from the scikit-learn package and RidgeCV from the statsmodels package. The code below uses Ridge class from Sklearn.linear_model to perform ridge regression. Unlike standard linear regression, which minimizes the sum of squared errors, ridge regression also includes a penalty term that minimizes the sum of squared coefficients. This penalty term is known as the alpha value. The sklearn library in Python implements ridge regression with the Ridge class. The Ridge class takes an alpha parameter, which specifies the amount of regularization to apply.
The example below shows how to use ridge regression to predict the prices of houses in Boston using the dataset from the scikit-learn package. The code first splits the data into training and test sets and then fits a ridge regression model on the training set. An instance of Ridge is created with a value of alpha as 0.1. The alpha value determines how much weight is given to the penalty term. A higher alpha value means that more weight is given to the penalty term, and a lower alpha value means that less weight is given to the penalty term. In this example, the alpha value is set to 0.1. This means that the penalty term will be given a weight of 0.1.
import pandas as pd
from sklearn.model_selection import train_test_split
from sklearn.preprocessing import StandardScaler
from sklearn.linear_model import Ridge
from sklearn.pipeline import make_pipeline
from sklearn.metrics import mean_squared_error, r2_score
from sklearn import datasets
#
# Load the Sklearn Boston Dataset
#
boston_ds = datasets.load_boston()
X = boston_ds.data
y = boston_ds.target
#
# Create a training and test split
#
X_train, X_test, y_train, y_test = train_test_split(X, y, test_size=0.3, random_state=42)
#
# Fit a pipeline using Training dataset and related labels
# Use Ridge algorithm for training the model
#
pipeline = make_pipeline(StandardScaler(), Ridge(alpha=1.0))
pipeline.fit(X_train, y_train)
#
# Calculate the predicted value for training and test dataset
#
y_train_pred = pipeline.predict(X_train)
y_test_pred = pipeline.predict(X_test)
#
# Mean Squared Error
#
print('MSE train: %.3f, test: %.3f' % (mean_squared_error(y_train, y_train_pred),
                mean_squared_error(y_test, y_test_pred)))
#
# R-Squared
#
print('R^2 train: %.3f, test: %.3f' % (r2_score(y_train, y_train_pred), r2_score(y_test, y_test_pred)))
References
Check out the following related posts on linear regression models:
- Linear regression real-life example
- Lasso regression Python example
- Linear regression hypothesis testing: concepts & examples
Conclusions
Ridge regression is a powerful tool used in statistics and machine learning. It can be intimidating to learn at first, but with a few examples, it becomes much more manageable. Ridge regression is used when you have collinearity in your data. This happens when there are a lot of variables that are related to each other. When this happens, it’s hard to find the best linear model for your data because all of the variables are competing with each other. Ridge regression solves this problem by adding an extra parameter, alpha, which penalizes the coefficients for being too large. This makes it easier to find the best linear model and get accurate predictions from your data. In this post, we walked through how ridge regression works and showed an example in Python. If you want to learn more or have any questions, feel free to drop us a message. We’d be happy to help!

Check out my latest book titled as First Principles Thinking: Building winning products using first principles thinking.
- Mathematics Topics for Machine Learning Beginners - July 6, 2025
- Questions to Ask When Thinking Like a Product Leader - July 3, 2025
- Three Approaches to Creating AI Agents: Code Examples - June 27, 2025
Hi, great article! 🙂
There is only one thing that I find a little counterintuitive.
In the advantages of the Ridge regression you say “Second, it can be used even when there are outliers in the data.”. However, then, in the disadvantages we read “Finally, ridge regression is sensitive to outliers and can produce unstable results if the data contains outliers.”.
Could you provide some clarification?
Thank you!
Thank you for pointing that out. Ridge regression does offer some resistance to outliers, which are extreme data points that deviate significantly from the majority of the data. However, Lasso regression might be more appropriate to use with data having outliers.