Category Archives: Data analytics
Free IBM Data Sciences Courses on Coursera

In the rapidly evolving fields of Data Science and Artificial Intelligence, staying ahead means continually learning and adapting. In this blog, there is a list of around 20 free data science-related courses from IBM available on coursera.org that can help data science enthusiasts master different domains in AI / Data Science / Machine Learning. This list includes courses related to the core technical skills and knowledge needed to excel in these innovative fields. Foundational Knowledge: Understanding the essence of Data Science lays the groundwork for a successful career in this field. A solid foundation helps you grasp complex concepts easily and contributes to better decision-making, problem-solving, and the capacity to …
OKRs vs KPIs vs KRAs: Differences and Examples
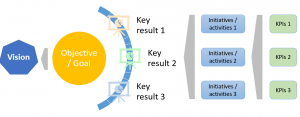
Last updated: 21st Feb, 2024 The difference between OKRs , KPIs, and KRAs is often confused, but the concept is a great way to measure the progress toward achieving your business objectives. As business analysts, product managers, and project or team leaders, it is important to understand the concepts of OKRs, KPIs, & KRAs and what’s the differences between them. In this blog post, we will discuss OKR vs KPI vs KRAs and how they can be used for setting goals/objectives and measuring different aspects of your team’s and organization’s performance in achieving those goals. We’ll also go over real-world examples so you can get a better understanding of how these metrics …
AI-Ready Data Explained with Examples

AI-ready data usually refers to data that has been prepared in such a way that it can be effectively used for training artificial intelligence (AI) and generative AI models. In this blog, we will learn about what are the most common attributes of AI-ready data. The following are the top most 5 attributes that AI-ready data would need to have. Data must be: Check out this Gartner paper for further details – We Shape AI, AI shapes us.
Online Scatter Plot Maker – Works with Your Excel Data
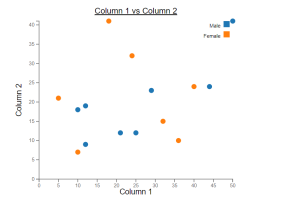
This online free tool, scatter plot creator, is designed to make data scatter plot visualization simpler, more efficient, and more integrated into your reporting. Scatter plots are invaluable for examining the relationship between two variables, identifying trends, outliers, and patterns. Whether you’re a data scientist, researcher, or data enthusiast, this tool will enable you to visualize your data effectively using scatter plots. The following are key features of this online scatter plot maker tool: Create Scatter Plots
Types of SQL Joins: Differences, SQL Code Examples
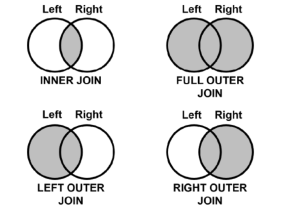
Structured Query Language (SQL) is one of the most important and widely used tools for data manipulation. It allows users to interact with databases, query and manipulate data, and create reports. One of SQL’s most important features is its ability to join tables together in order to enrich, compare and analyze related data. These joins are termed as inner join, outer join, left join and right join. In this article, we will discuss the different types of joins available in SQL, their differences and provide examples of how each can be used. What is SQL Join? SQL Joins are a technique used in Structured Query Language (SQL) to combine two …
Data Analytics for Car Dealers: Actionable Insights
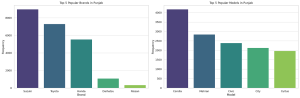
Are you starting a car dealership and wondering how to leverage data to make informed business decisions? In today’s data-driven world, analytics can be the difference between a thriving business and a failing one. This blog aims to provide actionable insights for car dealers, especially those starting new car dealer business, to excel in various business aspects. I will cover inventory management, pricing strategy, marketing and sales, customer service, and risk mitigation, all backed by data analytics. I will continue to update this blog with more methods in time to come. The data used for analysis can be found on the Kaggle.com – Ultimate Car Price Prediction Dataset. First and …
Unemployment Data & Actionable Insights Examples
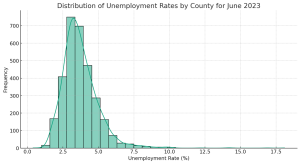
Unemployment figures often flood the news, painting a broad picture of economic stability or crisis. But have you ever wondered how these rates break down at the local level? Do certain counties (or cities) in different states fare better or worse than the national average, and if so, why? Unemployment is a critical indicator of economic health and social well-being. While national or state-level unemployment rates often make headlines, diving deeper into county-level or city level data can offer valuable insights for local governments, policymakers, and social organizations. In this blog, we will explore a dataset that provides unemployment rates for various U.S. counties in June 2023. Along the way, …
Contract Analysis & Review Checklist: Questions, Examples
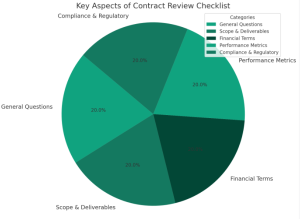
Have you ever found yourself knee-deep in contractual jargon, wondering if you’ve missed a critical clause that could cost your organization thousands or even millions? How confident are you that every contract your team signs is optimized for both performance and cost efficiency? If you’re a procurement stakeholder, a category manager, or a contract specialist, these questions are not just hypothetical—they’re the daily challenges you face. In this blog, you will learn about a structured approach to learning, understanding, and reviewing contracts, minimizing risks, and maximizing value based on asking the right kind of questions. We delve into key questions you should be asking, highlight essential clauses to scrutinize, and …
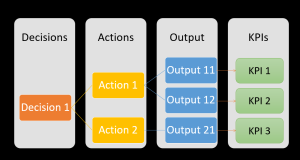
Actionable Insights: Examples & Concepts
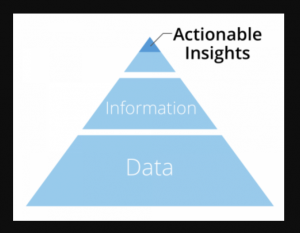
The idea of actionable insights is something that has gone mainstream across different departments in any and every business due to the onset of decision-centric analytics and digital transformation initiatives at large. Today, actionable insights are at the heart of many successful business decisions, and are used to help companies grow further than ever before. Actionable insights are key to any data analytics initiatives including decision-centric analytics which are at the heart of digital transformation. Analytics centered around actionable insights can also be termed as actionable analytics. In this blog post, we will understand the concepts of actionable insights with the help of examples along with few actionable analytics tools …
Analytical thinking & Reasoning: Real-life Examples
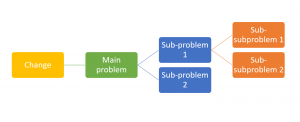
Analytical thinking and analytical reasoning are two concepts that are often misunderstood. Many people think that they are the same thing, but this is not the case. In fact, analytical thinking and analytical reasoning are two very different things, however, related. Analytical thinking is an important aspect of analytical skills. Most of us do not realize how to use analytical thinking and often end up solving the problem incorrectly or half-heartedly. As data analysts or data scientists, it would be of utmost importance to acquire this skill well. In this blog post, we will learn these concepts with the help of some real-life examples. What’s Analytical Thinking? Before we get …
Business Analytics vs Business Intelligence (BI): Differences
If you work in the field of data analysis, you’ve probably heard the terms “business analytics” and “business intelligence” used interchangeably. However, although they are similar, there are some important differences between the two concepts. In this blog post, we’ll take a closer look at business analytics and business intelligence and explore the key ways in which they differ. What is Business Analytics? Business analytics is a set of analytical methods and tools / technologies for analyzing and solving business problems by gathering and analyzing data from disparate data sources, and, understanding, discovering and communicating significant patterns in the data. In other words, it is a process or set of …
Dashboard Design Best Practices: Examples
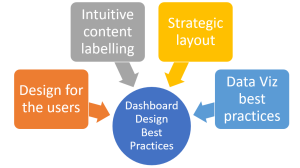
Are you looking to create effective, user-centric, and highly actionable data dashboards? Do you want your dashboard to not just present data, but tell a story that compels your team to make informed decisions? In an age of data-driven decision making, dashboards have become an indispensable tool for product managers, data analysts, and data visualization experts alike. A well-designed dashboard provides a real-time visual snapshot of performance, highlights crucial metrics, and assists in spotting trends or anomalies. However, designing a good dashboard is both an art and a science. It demands a deep understanding of users’ needs, a strategic approach to information organization, and an adept use of data visualization …
Difference between Data Science & Data Analytics
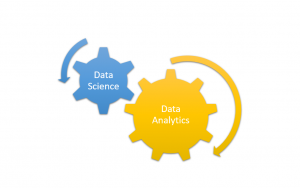
What’s the difference between data science and data analytics? Many people use these terms interchangeably, but there is a big distinction between the two fields. Data science is more focused on understanding and deriving insights from data while leveraging statistical and machine learning methods, while data analytics is an overarching term used to solve problems using analytical techniques while leveraging data. Both the terms are in a way related. In this blog post, we’ll explore the differences between data science and data analytics in greater detail, with examples of each. The following are key topics in relation to the difference between data science and data analytics: Different forms/purposes Different techniques …
How to Identify Analytics Use Cases for Solving Business Problems
In today’s data-driven world, data analytics has become a key aspect of business decision making. Organizations are increasingly relying on data analytics to gain insights into their operations and customers, in order to drive growth and profitability. However, the challenge for many businesses is not in understanding the importance of analytics, but in identifying the right use cases for their particular business problems, execute those use cases and deliver in a timely manner. This is where a structured approach to identifying analytics use cases becomes critical. In this blog post, we will explore how product managers and data scientists can work with business owners and identify analytics use cases that …
Data Analytics Explained: What, Why & How?
Data analytics has become a buzzword in the business world today, and for all good reasons indeed as it brings competitive advantage to the business if leveraged in the most appropriate manner. The ability to collect, process, and analyze large amounts of data in order to solve business problems has given organizations unprecedented insights into their operations, customers, and markets. By leveraging these insights, businesses can make informed decisions also called as data-driven decisions, identify new opportunities, and drive growth. But what exactly is data analytics? What are the different forms of data analytics? Why is it so important? And how can businesses leverage it to their advantage? How can …
Analytics COE Team: Roles & Responsibilities

Data analytics Centers of Excellence (CoEs) are the key to unlocking a company’s full potential with data. As a business leader, you know how important it is to stay ahead of the curve and have access to timely, accurate analytics that can help inform decisions. But having access to this data isn’t enough—you need an experienced team in place who understand the nuances of data analytics, can develop models and uncover insights that drive business decisions. That’s where data analytics CoEs come in. In this blog post, we’ll explore the roles and responsibilities of staff members in data analytics CoEs, as well as their importance in enabling organizations by delivering …
I found it very helpful. However the differences are not too understandable for me