Ever wondered how to find out if different groups of people have different preferences? Maybe you’re a marketer trying to understand if different age groups prefer different features in a smartphone. Or perhaps you’re a public policy researcher, trying to determine if different neighborhoods are equally satisfied with their local services. How do you go about answering these questions, especially when the data doesn’t follow the typical bell-shaped curve or normal distribution?
The solution lies in the Kruskal-Wallis H Test! This is a non-parametric test that helps to compare more than two independent groups and it comes in really handy when the data is not bell-shaped curve data or not based on normal distribution. In this blog post, you will learn about the Kruskal-Wallis H Test including formulas and real-world examples, and how to implement it in Python.
What is Kruskal Wallis H Test?
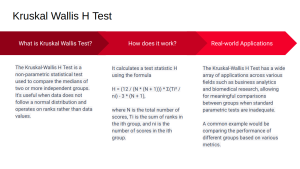
The Kruskal-Wallis H Test is a non-parametric statistical test used to determine if there are statistically significant differences between two or more groups of an independent variable on a continuous or ordinal dependent variable. The primary problem the Kruskal-Wallis H Test solves is to test the null hypothesis that the population median of all of the groups are equal. It is used when the assumptions of One-Way ANOVA (Analysis of Variance) are not met, particularly when the data doesn’t follow a normal distribution or when the variances are not homogeneous.
The test operates by ranking all data from all groups together, from lowest to highest. It then calculates the mean rank for each group and uses these rank means to determine if the groups differ significantly.
What’s unique about the Kruskal-Wallis H Test is that, unlike parametric tests such as the One-Way ANOVA, it doesn’t assume a normal distribution of your data. This makes the Kruskal-Wallis H Test a more robust method when dealing with non-normally distributed data. It is also less sensitive to outliers.
The formula for H in the Kruskal-Wallis H statistic is given below:
H = (12 / (N * (N + 1))) * Σ(Ti² / ni) – 3 * (N + 1)
Where:
- H is the Kruskal-Wallis test statistic.
- N is the total number of scores (from all groups).
- Σ(Ti² / ni) is the sum of the squared sum of ranks (Ti) for each group divided by the number of scores in the group (ni).
- Ti is the sum of the ranks in the ith group.
- ni is the number of scores in the ith group.
The test statistic H follows approximately a chi-square distribution with (k-1) degrees of freedom, where k is the number of groups. This approximation is used to determine the p-value, which helps in deciding whether to reject or not reject the null hypothesis. The null hypothesis for the Kruskal-Wallis H Test states that all groups have the same population median. If the calculated H is significantly large, then we have evidence to reject the null hypothesis, suggesting that at least one group’s population median is different from the others.
In terms of users, a diverse range of researchers and practitioners can benefit from this test. This can include social scientists looking to compare ordinal ratings across different groups, biologists comparing growth rates of different species, epidemiologists comparing disease rates across different regions, data analysts making comparisons between different user groups, and so on.
Kruskal Wallis Test Explained with Example
Let’s imagine we’re judges on a food-tasting show, and we’ve got three chefs, each cooking their version of spaghetti. Now, we all taste their dishes and rate them on a scale of 1 to 10. The question we want to answer is, are these dishes really different in terms of taste, or did it just happen by chance that we rated them differently?
And what if we didn’t have just three chefs but thirty? What if they’re all using different ingredients and different techniques? How can we judge then? The problem gets messier, right? That’s where the Kruskal-Wallis H Test comes to the rescue.
The following table represents the spaghetti scores from three different chefs represented by Chef A, B and C.
| Different Chefs | Scores (out of 10) |
|---|---|
| A | 7 |
| A | 8 |
| A | 6 |
| A | 7 |
| A | 9 |
| B | 6 |
| B | 7 |
| B | 5 |
| B | 6 |
| B | 8 |
| C | 8 |
| C | 9 |
| C | 8 |
| C | 8 |
| C | 9 |
Step 1 – Ranking the scores: As a first step, Kruskal Wallis ranks the scores from all the groups together from lowest to highest. This is what it looks like. For the ranks with the same score, the rank is calculated by taking the average of the tied ranks. Thus, for score 6, the tied ranks are 2, 3, and 4. The average of these ranks will be (2 + 3 + 4)/3 = 3.
| Chef | Score | Rank |
|---|---|---|
| B | 5 | 1 |
| B | 6 | 3 |
| B | 6 | 3 |
| A | 6 | 3 |
| B | 7 | 6 |
| A | 7 | 6 |
| A | 7 | 6 |
| B | 8 | 10 |
| A | 8 | 10 |
| C | 8 | 10 |
| C | 8 | 10 |
| C | 8 | 10 |
| A | 9 | 14 |
| C | 9 | 14 |
| C | 9 | 14 |
Step 2 – Calculate average rank for each group: As a second step, it looks at these ranks and calculates the average rank for each group. This is what it would look like:
- Chef A: (4+6+7+9+13) / 5 = 7.8
- Chef B: (1+2+3+5+8) / 5 = 3.8
- Chef C: (10+11+12+14+15) / 5 = 12.4
According to the Kruskal-Wallis H Test, these average ranks are then used to determine if at least one chef’s spaghetti stands out significantly in terms of taste. We’d use a mathematical formula to calculate the ‘H’ statistic.
Step 3: Calculate H value – As a next step, we use the Kruskal-Wallis H formula to calculate an ‘H’ value.
The formula is as follows:
H = (12 / (n(n+1))) Σ[R^2/n] – 3(n+1)
Where:
- n is the total number of observations (all scores of all chefs combined),
- Σ[R^2/n] is the sum of the squared ranks divided by the number of observations in each group.
Let’s use the chef data to calculate H.
We have:
- n = 15 (5 scores from each chef)
- Chef A’s R = 3 + 6 + 6 + 10 + 14 = 39, and n_A = 5
- Chef B’s R = 1 + 3 + 3 + 6 + 10 = 23, and n_B = 5
- Chef C’s R = 10 + 10 + 10 + 14 + 14 = 58, and n_C = 5
Substitute these values into the formula:
H = (12 / (15*16)) * [(39^2 / 5) + (23^2 / 5) + (58^2 / 5)] – 3*16
H = (0.05) * (304.2 + 105.8 + 672.8) – 48
H = (0.05) * (1082.8) – 48
H = 54.14 – 48
H = 6.14
Now, we need to compare our calculated H value with the critical value from the Chi-Square distribution. For this, we also need the degrees of freedom, which is the number of groups minus 1. Since we have 3 chefs (groups), the degree of freedom (df) is 2.
Now, we look up the critical value in a Chi-Square distribution table for df = 2. Typically, we use a significance level of 0.05 (95% confidence level), which gives us a critical value of 5.991.
Our calculated H value (6.14) is greater than the critical value (5.991). Therefore, we reject the null hypothesis. We conclude that there is a statistically significant difference in the taste ratings given to the three chefs.
Kruskal Wallis H Test: Python Example
To perform the Kruskal-Wallis H Test in Python, you can use the scipy.stats library. Below is the Python code for performing the Kruskal-Wallis H Test using the chef example. The kruskal function from scipy.stats library. is used to perform the Kruskal-Wallis H Test. The function takes the scores from each chef as input and returns the H statistic and the p-value. We then compare the p-value to our chosen significance level (alpha), typically set at 0.05, to determine if we should reject the null hypothesis.
import scipy.stats as stats

# Data for the chefs
chef_a_scores = [7, 8, 6, 7, 9]
chef_b_scores = [6, 7, 5, 6, 8]
chef_c_scores = [8, 9, 8, 8, 9]

# Perform the Kruskal-Wallis H Test
h_statistic, p_value = stats.kruskal(chef_a_scores, chef_b_scores, chef_c_scores)

# Output the results
print(f"H Statistic: {h_statistic}")
print(f"P-Value: {p_value}")

# Evaluate the hypothesis
alpha = 0.05
if p_value < alpha:
    print("We reject the null hypothesis. There is a significant difference between the groups.")
else:
    print("We fail to reject the null hypothesis. There is no significant difference between the groups.")
Conclusion
To sum it up, the Kruskal-Wallis H Test stands as a powerful non-parametric statistical methodology designed to gauge the medians of two or more unrelated groups. This test becomes especially helpful when your data doesn’t conform to a normal distribution. How Kruskal Wallis test work is based on the ranks of the data, rather than the actual data values. This provides a great approach to detecting significant differences between groups. In this blog, we learned about the details of how the Kruskal-Wallis H Test works, breaking down its formula and inner mechanics.
The versatility of the Kruskal-Wallis H Test is reflected in its wide array of practical applications, a point we illustrated with a real-world example of comparing chefs’ performances using taste test scores. This instance underlines the test’s value in diverse fields, including business analytics and biomedical research. As you gain proficiency in the Kruskal-Wallis H Test, you’ll find it a valuable asset in your data analysis toolkit, facilitating nuanced comparisons when typical parametric tests are inadequate. Regardless of whether you’re a data science novice or a seasoned researcher, understanding the Kruskal-Wallis H Test empowers you to delve deeper into your data, deriving insightful conclusions and making informed decisions.

Check out my latest book titled as First Principles Thinking: Building winning products using first principles thinking.
- Three Approaches to Creating AI Agents: Code Examples - June 27, 2025
- What is Embodied AI? Explained with Examples - May 11, 2025
- Retrieval Augmented Generation (RAG) & LLM: Examples - February 15, 2025
I found it very helpful. However the differences are not too understandable for me