Category Archives: Data Science
Data Storytelling Explained with Examples
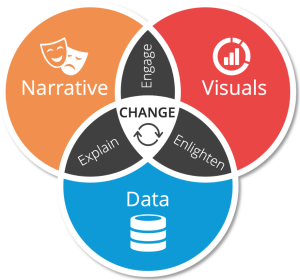
Have you ever told a story to someone, but they just didn’t seem to understand it? They might have been confused about the plot or why the characters acted in certain ways. If this has happened to you before, then you are not alone. Many people struggle with storytelling or rather data storytelling because they do not know how to communicate their data effectively to tell an engaging story. Data storytelling is a powerful tool that can be used to educate, inform or persuade an audience by using different kinds of narration. By using charts, graphs, images and other visuals, data can be made more interesting and engaging. Data storytelling …
Quiz: Linear Regression & F-Statistics

Linear Regression is one of the most widely used statistical methods for predictive modeling in various fields such as finance, marketing, and engineering. It involves fitting a linear equation to a set of data points, which can be used to make predictions about new data. One important aspect of linear regression is the use of F-Statistics, which is a statistical test used to determine the significance of the regression model. If you’re looking to test your knowledge of Linear Regression and F-Statistics, you’ve come to the right place! It will also be helpful if you are preparing for data science interviews. In this capsule quiz, we’ve compiled 10 questions that …
Python – Draw Confusion Matrix using Matplotlib
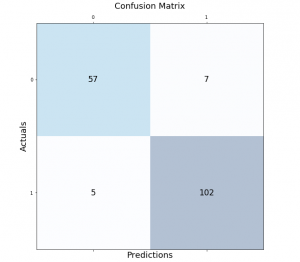
Classification models are a fundamental part of machine learning and are used extensively in various industries. Evaluating the performance of these models is critical in determining their effectiveness and identifying areas for improvement. One of the most common tools used for evaluating classification models is the confusion matrix. It provides a visual representation of the model’s performance by displaying the number of true positives, false positives, true negatives, and false negatives. In this post, we will explore how to create and visualize confusion matrices in Python using Matplotlib. We will walk through the process step-by-step and provide examples that demonstrate the use of Matplotlib in creating clear and concise confusion …
Degree of Freedom in Statistics: Meaning & Examples
The degree of freedom (DOF) is a term that statisticians use to describe the degree of independence in statistical data. A degree of freedom can be thought of as the number of variables that are free to vary, given one or more constraints. When you have one degree, there is one variable that can be freely changed without affecting the value for any other variable. As a data scientist, it is important to understand the concept of degree of freedom, as it can help you do accurate statistical analysis and validate the results. In this blog, we will explore the meaning of degree of freedom in statistics, its importance in …
Different types of Time-series Forecasting Models
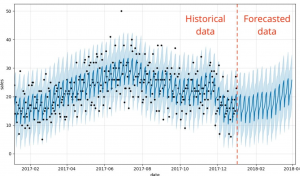
Forecasting is the process of predicting future events based on past and present data. Time-series forecasting is a type of forecasting that predicts future events based on time-stamped data points. Time-series forecasting models are an essential tool for any organization or individual who wants to make informed decisions based on future events or trends. From stock market predictions to weather forecasting, time-series models help us to understand and forecast changes over time. However, with so many different types of models available, it can be challenging to determine which one is best suited for a particular scenario. There are many different types of time-series forecasting models, each with its own strengths …
Support Vector Machine (SVM) Python Example
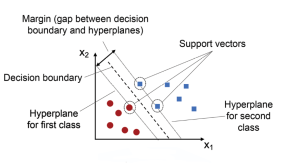
Support Vector Machines (SVMs) are a powerful and versatile machine learning algorithm that has gained widespread popularity among data scientists in recent years. SVMs are widely used for classification, regression, and outlier detection (one-class SVM), and have proven to be highly effective in solving complex problems in various fields, including computer vision (image classification, object detection, etc.), natural language processing (sentiment analysis, text classification, etc.), and bioinformatics (gene expression analysis, protein classification, disease diagnosis, etc.). In this post, you will learn about the concepts of Support Vector Machine (SVM) with the help of Python code example for building a machine learning classification model. We will work with Python Sklearn package for building the …
Fixed vs Random vs Mixed Effects Models – Examples
Have you ever wondered what fixed effect, random effect and mixed effects models are? Or, more importantly, how they differ from one another? In this post, you will learn about the concepts of fixed and random effects models along with when to use fixed effects models and when to go for fixed + random effects (mixed) models. The concepts will be explained with examples. As data scientists, you must get a good understanding of these concepts as it would help you build better linear models such as general linear mixed models or generalized linear mixed models (GLMM). What are fixed, random & mixed effects models? First, we will take a real-world example and try and understand …
CNN Basic Architecture for Classification & Segmentation

As data scientists, we are constantly exploring new techniques and algorithms to improve the accuracy and efficiency of our models. When it comes to image-related problems, convolutional neural networks (CNNs) are an essential tool in our arsenal. CNNs have proven to be highly effective for tasks such as image classification and segmentation, and have even been used in cutting-edge applications such as self-driving cars and medical imaging. Convolutional neural networks (CNNs) are deep neural networks that have the capability to classify and segment images. CNNs can be trained using supervised or unsupervised machine learning methods, depending on what you want them to do. CNN architectures for classification and segmentation include …
Neural Network & Multi-layer Perceptron Examples
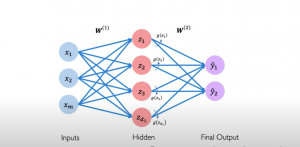
Neural networks are an important part of machine learning, so it is essential to understand how they work. A neural network is a computer system that has been modeled based on a biological neural network comprising neurons connected with each other. It can be built to solve machine learning tasks, like classification and regression problems. The perceptron algorithm is a representation of how neural networks work. The artificial neurons were first proposed by Frank Rosenblatt in 1957 as models for the human brain’s perception mechanism. This post will explain the basics of neural networks with a perceptron example. You will understand how a neural network is built using perceptrons. This …
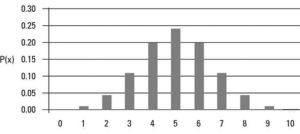
Positively Skewed Probability Distributions: Examples
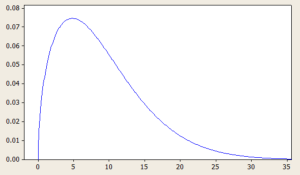
Probability distributions are an essential concept in statistics and data analysis. They describe the likelihood of different outcomes or events occurring and provide valuable insights into the characteristics of a given data set. Skewness is an important aspect of probability distributions that can have a significant impact on data analysis and decision-making. In this blog, we will focus on positively skewed probability distributions and explore some real-life examples where these distributions occur. We will discuss what a positively skewed distribution is, what are its different types with formula and definitions. By the end of this blog, you will have a better understanding of positively skewed distributions and be able to …
Generative vs Discriminative Models: Examples
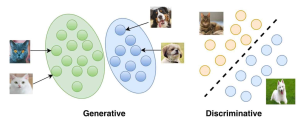
The field of machine learning is rapidly evolving, and with it, the concepts and techniques that are used to develop models that can learn from data. Among these concepts, generative and discriminative models are two widely used approaches in the field. Generative models learn the joint probability distribution of the input features and output labels, whereas discriminative models learn the conditional probability distribution of the output labels given the input features. While both models have their strengths and weaknesses, understanding the differences between them is crucial to developing effective machine learning systems. Real-world problems such as speech recognition, natural language processing, and computer vision, require complex solutions that are able …
Sequence to Sequence Models: Types, Examples
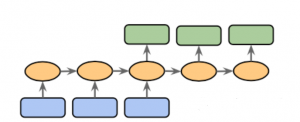
Sequence to sequence (Seq2Seq) modeling is a powerful machine learning technique that has revolutionized the way we do natural language processing (NLP). It allows us to process input sequences of varying lengths and produce output sequences of varying lengths, making it particularly useful for tasks such as language translation, speech recognition, and chatbot development. Sequence to sequence modeling also provides a great foundation for creating text summarizers, question answering systems, sentiment analysis systems, and more. With its wide range of applications, learning about sequence to sequence modeling concepts is essential for anyone who wants to work in the field of natural language processing. This blog post will discuss types of …
Statistics Terminologies Cheat Sheet & Examples
Have you ever felt overwhelmed by all the statistics terminology out there? From sampling distribution to central limit theorem to null hypothesis to p-values to standard deviation, it can be hard to keep up with all the statistical concepts and how they fit into your research. That’s why we created a Statistics Terminologies Cheat Sheet & Examples – a comprehensive guide to help you better understand the essential terms and their use in data analysis. Our cheat sheet covers topics like descriptive statistics, probability, hypothesis testing, and more. And each definition is accompanied by an example to help illuminate the concept even further. Understanding statistics terminology is critical for data …
Machine Learning Bias Explained with Examples
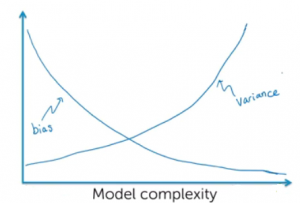
In the artificial intelligence (AI) / machine learning (ML) powered world where predictive models have started getting used more often in decision-making areas, the primary concerns of policy makers, auditors and end users have been to make sure that these systems using the models are not making biased/unfair decisions based on model predictions (intentional or unintentional discrimination). Imagine industries such as banking, insurance, and employment where models are used as solutions to decision-making problems such as shortlisting candidates for interviews, approving loans/credits, deciding insurance premiums etc. How harmful it could be to the end users as these decisions may impact their livelihood based on biased predictions made by the model, thereby, …
Geometric Distribution Concepts, Formula, Examples
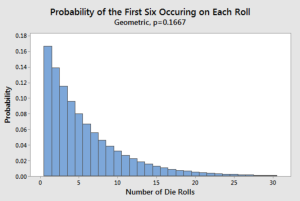
Geometric Distribution, a widely used concept in probability theory, is used to represent the probability of achieving success or failure in a series of independent trials, where the probability of success remains constant. It is one of the essential tools used in a wide range of fields, including economics, engineering, physics, and statistics. As data scientists / statisticians, it is of utmost important to understand its concepts and applications in a clear manner. In this blog, we will introduce you to the basics of Geometric distribution, starting with its definition and properties. We will also explore the geometric distribution formula and how it is used to calculate the probability of …
Data value chain: Framework, Concepts
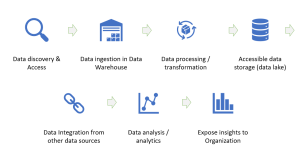
As organizations become increasingly data-driven, understanding the value of data is critical for success. The data value chain framework helps to identify and maximize the value of data by breaking it down into its components. In this post, we will explain what a data value chain is, why it’s important, and how to implement it. Data Value Chain Framework: Key Stages The data value chain (DVC) is a business model that helps organizations understand how to create, manage and utilize their data assets in order to realize maximum business value based on using them. It breaks down the various stages of an organization’s entire journey with its data into distinct …
I found it very helpful. However the differences are not too understandable for me