Last updated: 11th Dec, 2023
In this blog post, we will take a look at the concepts and formula of f-test and related f-statistics in linear regression models and understand how to perform f-test and interpret f-statistics in linear regression with the help of examples.
F-test and related F-statistics interpretation is key if you want to assess if the linear regression model results in a statistically significant fit to the data overall. An insignificant F-test determined by the f-statistics value vis-a-vis critical region implies that the predictors have no linear relationship with the target variable. We will start by discussing the importance of F-test and f-statistics in linear regression models and understand the formula based on which f-statistics get claculated. We will, then, understand the f-test and f-statistics concept with some real-world examples. As data scientists, it is very important to understand both the f-statistics and t-statistics in linear regression models and how they help in coming up with most appropriate regression models.
F-test / F-statistics & Linear Regression Model
Linear regression is a fundamental statistical technique used to model the relationship between a dependent variable (also known as the response or target variable) and one or more independent variables (also known as predictors or features). The main goal of linear regression is to find the best-fitting line through the data points, known as the regression line, which minimizes the sum of squared differences between the observed values and the predicted values. There are different types of hypothesis tests such as t-test and f-test (discussed in this blog) which are used for assessing the suitability of the linear regression model describing dependent variables as a function of one or more appropriate independent variables and related coefficients. You may want to check this blog to learn more – linear regression hypothesis testing example.
What does f-test and f-statistic mean in linear regression? What hypothesis is tested?
F-statistics is used to test the hypothesis such as F-test determining whether the regression model as a whole (including all the predictor variables) explains a significant amount of the variation in the dependent variable, compared to a model with no predictors (known as the null model). F-test and f-statistics helps assess the significance of the entire linear regression model.
The hypothesis that needs to be tested using F-test is whether a linear regression model exists for the function approximation representing response variable as a linear function of predictor variables.
This is tested by setting the null hypothesis that the response variable can not be represented as a function of any of the predictor variables. Thus, if the following is a linear regression model or function:
y = β0 + β1×1 + β2×2 + β3×3,
Where
- y is the response variable
- x1, x2, and x3 are predictor variables
- β1, β2, β3 are coefficients or parameters to be estimated for x1, x2, and x3 predictor variables
Then, the null and alternate hypotheses can be written as:
Null hypothesis, H0: β1 = β2 = β3 = 0 (Regression model does not exist)
Alternate hypothesis, Ha: Any one of the coefficients is not equal to zero; At least one βi is not equal to 0
The above hypothesis can be tested using statistical test such as F-test. And, the test statistics is called f-statistics.
What does F-test / F-statistics tell you in relation to Linear Regression Model?
F-statistics is based on the ratio of two variances: the explained variance (due to the model) and the unexplained variance (residuals). In other words, F-statistics compares the explained variance (due to the model) and the unexplained variance (residuals). By comparing these variances, F-statistics helps us determine whether the regression model significantly explains the variation in the dependent variable or if the variation can be attributed to random chance.
The f-test / f-statistic formula for simple or multiple regression model can be calculated as the following:
f = MSR / MSE
= Mean sum of squares regression / Mean sum of squares error
The F-statistic follows an F-distribution, and its value helps to determine the probability (p-value) of observing such a statistic if the null hypothesis is true (i.e., no relationship between the dependent and independent variables). If the p-value is smaller than a predetermined significance level (e.g., 0.05), the null hypothesis is rejected, and we conclude that the regression model is statistically significant.
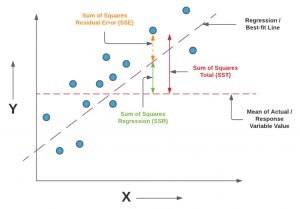
Let’s learn the concept of mean sum of squares regression (MSR) and mean sum of squares error / residual (MSE) in terms of explained and unexplained variance using the diagram shown below:
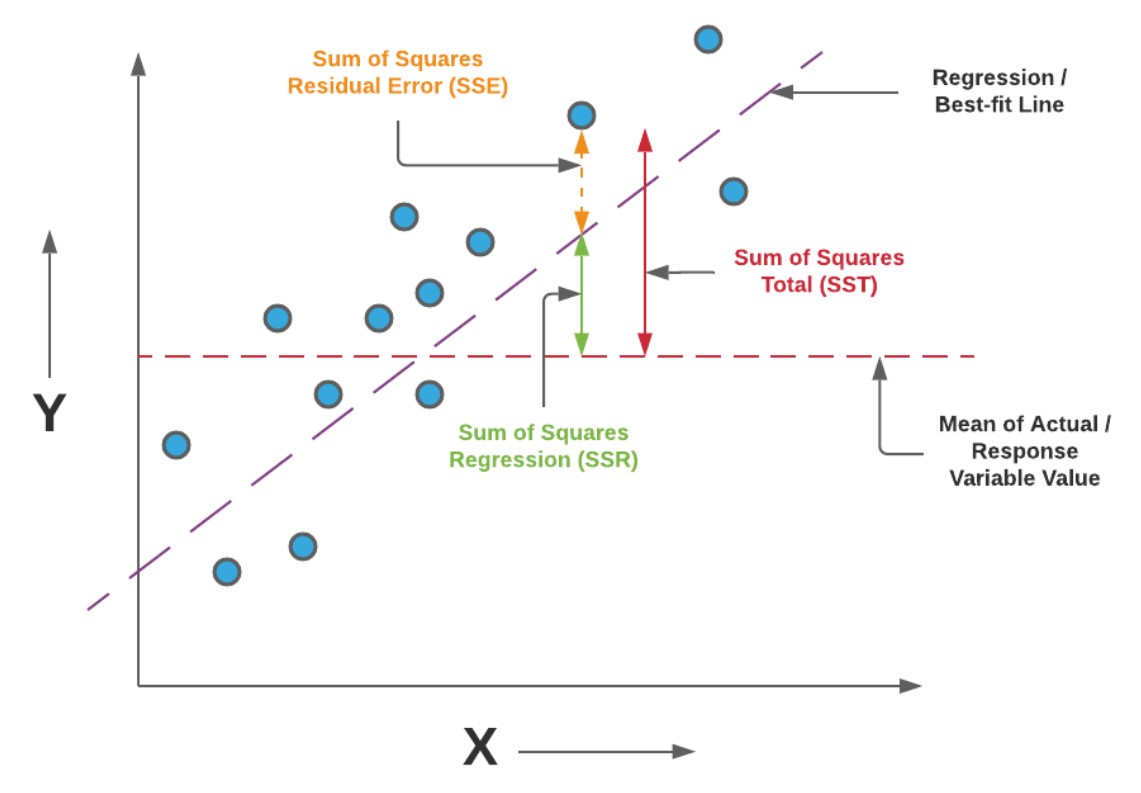
In the above diagram, the variance explained by the regression model is represented using the sum of squares for the model or sum of squares regression (SSR). The variance not explained by the regression model is the sum of squares for error (SSE) or the sum of squares for residuals. The f-statistics is defined as a function of SSR and SSE in the following manner:
$\Large f = (SSR/DF_{ssr}) / (SSE/DF_{sse})$
$DF_{ssr}$ = Degree of freedom for regression model; The value is equal to the number of parameters or coefficients
$\Large DF_{ssr} = p$
$DF_{sse}$= Degree of freedom for error; The value is equal to the total number of records (N) minus the number of coefficients (p)
$\Large DF_{sse}$ = N – p – 1
Thus, the f-statistics or f-value formula for can be written as the following:
$\Large f = \frac{\frac{SSR}{p}}{\frac{SSE}{N – p – 1}}$
How to interpret the output of f-test, e.g., f-statistics in linear regression models?
A larger F-statistic might indicate that the linear regression model accounts for a substantial portion of the total variance, while a smaller F-statistic suggests that the model might not explain much of the variance and thus, may not be seen as useful model.
Importance of understanding F-statistics in Linear Regression Model
Understanding F-statistics is crucial for anyone working with linear regression models for several reasons:
- Model significance: F-statistics allows you to assess the overall significance of the model, which helps determine whether the model is worth interpreting further or needs improvement.
- Variable selection: F-statistics can be used as a criterion for variable selection, helping you identify the most important predictor variables and build a parsimonious model.
- Model comparison: F-statistics can be employed to compare the performance of different models, especially when adding or removing predictor variables.
F-test & F-statistics Example for Linear Regression Model
In this section, we will learn about how to perform F-test and calculate f-statistics for linear regression model and interpret the f-statistics value with the help of an example.
Perform F-test on Linear Regression Model
Let’s say we have a problem estimating the sales in terms of the household income, age of head of the house, and the household size. We have a data set of 200 records. The following is the linear regression model:
y = β0 + β1*Income + β2*HH.size + β3*Age
Where y is the estimated sales, Income is the household income (in $1000s), Age is the age of head of house (in years) and HH.size is the household size (number of people in the household).
The following represents the hypothesis test for the linear regression model:
H0: β1 = β2 = β3 = 0
Ha: At least one of the coefficients is not equal to zero.
Now, let’s perform the hypothesis testing by calculating f-statistics for this problem.
DFssr = p = 3 (Number of coefficients)
SSR is calculated as 770565.1
MSR = SSR/DFssr = 770565.1 / 3 = 256855.033
DFsse = N – p – 1 = 200 – 3 – 1 = 196
SSE is calculated as 1557415.4
MSE = SSE/DFsse = 1557415.4 / 196 = 7945.99
The f-statistic can be calculated using the following formula:
f = MSR / MSE
= 256855.033 / 7945.99
= 32.325
The f-statistics can be represented as the following:
f = 32.325 at the degree of freedom as 3, 196.
Interpreting F-statistics for F-test hypothesis evaluation
The next step will be to find out the critical value of F-statistics at the level of significance as 0.05 with the degree of freedom as 3, 196.
f (critical value) = 2.651.
As the f-statistics of 32.325 is greater than the critical value of 2.651, it means that there’s statistical evidence for rejecting H0: β1=β2=β3=0. We can reject the null hypothesis that the value of all coefficients = 0. Thus, the alternate hypothesis holds good which means that at least one of the coefficients related to the predictor variables such as income, age, and HH.size is non-zero.
Frequently Asked Questions (FAQs)
The following are some of the most frequently asked questions regarding usage of f-statistics in regression models:
- What is a good f-value or f-statistics in linear regression?
- In regression analysis, a high F-value (F-statistic) generally indicates that the model is statistically significant. While there’s no universal “good” value, as it depends on the context and the degrees of freedom, typically an F-value significantly larger than 1 suggests that the model is better than a model with no predictors. However, it’s important to also consider the p-value associated with the F-statistic. A small p-value (usually <0.05) alongside a high F-value is a strong indicator of a statistically significant model. Always interpret these statistics in the context of your specific data and research question.
- What is relationship between F-test and F-statistics in linear regression?
- In linear regression, the F-test uses the F-statistic to determine the statistical significance of the model. The F-statistic compares the variance explained by the model to the unexplained variance, and the F-test evaluates whether this ratio is significantly greater than expected under the null hypothesis, indicating a meaningful model.
- What is F-test in linear regression?
- The F-test in linear regression assesses the overall significance of a model by comparing the model’s fit with a baseline model, typically using the ratio of explained variance to unexplained variance to determine whether the observed relationships are statistically significant.
- Are F-test and T-test related in case of linear regression model?
- In linear regression, F-tests and t-tests serve complementary roles: the t-test evaluates the significance of individual coefficients, determining if each predictor significantly influences the response variable. The F-test, on the other hand, assesses the overall model significance, testing whether at least one predictor is effectively non-zero. Interestingly, in a single-predictor model, the square of the t-statistic for the predictor’s coefficient equals the model’s F-statistic. However, in multi-predictor models, while t-tests scrutinize each predictor’s impact, the F-test is crucial for gauging the collective explanatory power of all predictors.
- What are different ways in which f-statistics can be assessed for f-test hypothesis testing in linear regression?
- In F-test hypothesis testing for linear regression, the F-statistic is primarily assessed by comparing it against a critical value from the F-distribution, based on the model’s and error’s degrees of freedom and a chosen significance level, like 0.05. Additionally, the p-value associated with the F-statistic, typically calculated using statistical software, plays a key role; if it’s below the significance threshold, it indicates the model’s statistical significance, leading to the rejection of the null hypothesis.
Summary
The F-statistic is an essential statistical measure used in linear regression models to test the significance of regression coefficients. It is calculated as MSR/MSE, where MSR (Mean Sum of Squares due to Regression) is computed by dividing SSR (Sum of Squares due to Regression) by DFssr (degrees of freedom for the regression model), and MSE (Mean Sum of Squares due to Error) is obtained by dividing SSE (Sum of Squares due to Error) by DFsse (degrees of freedom for error). The critical value of the F-statistic is determined using the F-distribution, considering the appropriate degrees of freedom and desired significance level. In hypothesis testing, if the calculated F-statistic exceeds this critical value, it indicates a rejection of the null hypothesis, suggesting that the regression coefficients collectively have a significant impact on the model, thereby affirming a substantial relationship between the predictor variables and the response variable. This process, known as an F-test, is integral to assessing the overall efficacy of the regression model.

Check out my latest book titled as First Principles Thinking: Building winning products using first principles thinking.
- Three Approaches to Creating AI Agents: Code Examples - June 27, 2025
- What is Embodied AI? Explained with Examples - May 11, 2025
- Retrieval Augmented Generation (RAG) & LLM: Examples - February 15, 2025
Can you tell me what is the relationship between null hypothesis and F test? Here we can see that in F test there is no sign of coefficient becoming zero? Or we don,t use the null hypothesis in F test formula (like t test or Z test) to justify whether it is true or not!!
May be you didn,t understand my words. Lets think that null hypothesis is al coefficients are more than 3. Then how will you perform the F test?