
Last updated: 9th Dec, 2023
When building machine learning classification and regression models, understanding which features most significantly impact your model’s predictions can be as crucial as the predictions themselves. This post delves into the concept of feature importance in the context of one of the most popular algorithms available – the Random Forest. Whether used for classification or regression tasks, Random Forest not only offers robust and accurate predictions but also provides insightful metrics to find the most important features in your dataset. You will learn about how to use Random Forest regression and classification algorithms for determining feature importance using Sklearn Python code example. It is very important to understand feature importance and feature selection techniques for data scientists to use most important features for training machine learning models. Recall that other feature selection techniques includes L-norm regularization techniques, greedy search algorithms techniques such as sequential backward / sequential forward selection etc.
What & Why of Feature Importance?
Feature importance is a key concept in machine learning that refers to the relative importance of each feature in the training data. In other words, it tells us which features are most important in terms of predicting the values of the target variable with most accuracy. Determining feature importance is one of the key steps of machine learning model development pipeline. Feature importance can be calculated in a number of ways, but all methods typically rely on calculating some sort of score that measures how often a feature is used in the model and how much it contributes to the overall predictions.
Beyond Random Forest, feature importance in Python can be assessed using Linear Models for coefficient analysis, Gradient Boosting Machines (XGBoost, LightGBM) for built-in importance metrics, Permutation Importance for model-independent assessment, SHAP values for detailed explanations, and dimensionality reduction using PCA.
Feature importance example
Imagine a healthcare organization developing a machine learning model to predict the likelihood of patients being readmitted to the hospital within 30 days of discharge. They use a variety of features like patient age, diagnosis, length of stay, number of previous admissions, medication types, and lifestyle factors such as smoking status. By applying feature importance analysis using a Random Forest algorithm, the team discovers that the length of stay, number of previous admissions, and certain types of medication are the most important features in predicting readmissions. Surprisingly, lifestyle factors like smoking status, initially thought to be significant, have minimal impact according to the model. This insight allows the healthcare team to focus on optimizing post-discharge plans especially for patients with longer hospital stays and multiple admissions, potentially tailoring medication strategies to reduce readmission rates.
Why is feature importance important?
The following are some of the key reasons representing the importance of the feature importance:
- Model Simplification: By identifying which features contribute most to the model’s predictions, we can simplify the model by selecting only the most important features. This not only reduces the complexity but also speeds up the training process.
- Model Interpretability: Knowing which features are most important in a model helps in interpreting the model’s decisions. This is particularly important in fields where understanding the decision-making process is as important as the decision itself, such as in healthcare or finance.
- Improved Accuracy: Sometimes, removing irrelevant or less important features can actually improve the model’s accuracy by reducing the noise in the data.
- Enhanced Feature Engineering: Insights from feature importance can guide the process of feature engineering, helping in creating more meaningful features that could improve model performance.
- Regulatory and Ethical Compliance: In industries with strict regulatory requirements, understanding feature importance is crucial to ensure that models do not rely on discriminatory or sensitive features.
- Detecting Data Quality Issues: If unexpected features are identified as highly important, it might indicate issues with data quality or biases in the data, prompting a reevaluation of the dataset.
Feature importance & feature selection go hand-in-hand
Feature importance is used to select features for building models, debugging models, and understanding the data. The outcome of feature importance stage is a set of features along with the measure of their importance. Once the importance of features get determined, the features can be selected appropriately. One can apply feature selection and feature importance techniques to select the most important features. Note that the selection of key features results in models requiring optimal computational complexity while ensuring reduced generalization error as a result of noise introduced by less important features.
Feature importance metrics
Feature importance can be measured on a scale from 0 to 1, with 0 indicating that the feature has no importance and 1 indicating that the feature is absolutely essential. Feature importance values can also be negative, which indicates that the feature is actually harmful to the model performance.
Feature Importance using Random Forest
As discussed in prevision section, feature importance in machine learning involves evaluating the significance of the input features in predicting the target variable. The random forest algorithm, encompassing both the classifier and regressor variants, stands out for its inherent ability to rank features based on their importance. The random forest classifier feature importance and the random forest regressor feature importance are derived from the average decrease in impurity across all trees within the model, a process that is well-handled by the feature_importances_ attribute in the sklearn library.
Understanding what feature importance in random forest entails is key to model optimization and interpretability. Whether one employs the RandomForestClassifier or RandomForestRegressor from sklearn, the technique remains consistent. It allows for insightful feature importance visualization, making it easier to communicate the results. In Python, libraries such as sklearn provide straightforward methods to not only compute but also to retrieve and visualize this information, through feature_importances_ or by using methods tailored for feature selection in Python.
Python Sklearn RandomForestClassifier for Feature Importance
Sklearn RandomForestClassifier can be used for determining feature importance. It collects the feature importance values so that the same can be accessed via the feature_importances_ attribute after fitting the RandomForestClassifier model. Sklearn wine data set is used for illustration purpose. Here are the steps:
- Create training and test split
- Train the model using RandomForestClassifier
- Get the feature importance value
- Visualize the feature importance
Create the Train / Test Split
Here is the python code for creating training and test split of Sklearn Wine dataset. The code demonstrates how to work with Pandas dataframe and Numpy array (ndarray) alternatively by converting Numpy arrays to Pandas Dataframe.
import pandas as pd
from sklearn.model_selection import train_test_split
from sklearn.preprocessing import StandardScaler
from sklearn import datasets
#
# Load the wine datasets
#
wine = datasets.load_wine()
df = pd.DataFrame(wine.data)
df[13] = wine.target
df.columns = ['alcohal', 'malic_acid', 'ash', 'ash_alcalinity', 'magnesium', 'total_phenols', 'flavanoids', 'nonflavanoids_phenols', 'proanthocyanins', 'color_intensity', 'hue', 'od_dilutedwines', 'proline', 'class']
#
# Create training and test split
#
X_train, X_test, y_train, y_test = train_test_split(df.iloc[:, :-1], df.iloc[:, -1:], test_size = 0.3, random_state=1)
#
# Feature scaling
#
sc = StandardScaler()
sc.fit(X_train)
X_train_std = sc.transform(X_train)
X_test_std = sc.transform(X_test)
#
# Training / Test Dataframe
#
cols = ['alcohal', 'malic_acid', 'ash', 'ash_alcalinity', 'magnesium', 'total_phenols', 'flavanoids', 'nonflavanoids_phenols', 'proanthocyanins', 'color_intensity', 'hue', 'od_dilutedwines', 'proline']
X_train_std = pd.DataFrame(X_train_std, columns=cols)
X_test_std = pd.DataFrame(X_test_std, columns=cols)
Train the model using Sklearn RandomForestClassifier
Here is the python code for training RandomForestClassifier model using training and test data set created in the previous section:
from sklearn.ensemble import RandomForestClassifier

forest = RandomForestClassifier(n_estimators=500,
                                random_state=1)
#
# Train the mode
#
forest.fit(X_train_std, y_train.values.ravel())
Determine feature importance values
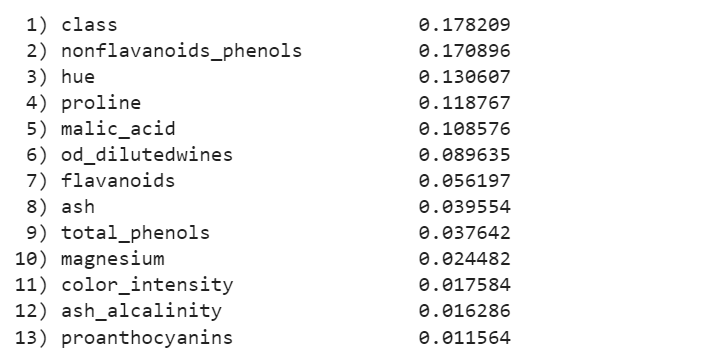
Here is the python code which can be used for determining feature importance. The attribute, feature_importances_ gives the importance of each feature in the order in which the features are arranged in training dataset. Note how the indices are arranged in descending order while using argsort method (most important feature appears first)
import numpy as np

importances = forest.feature_importances_
#
# Sort the feature importance in descending order
#
sorted_indices = np.argsort(importances)[::-1]

feat_labels = df.columns[1:]

for f in range(X_train.shape[1]):
    print("%2d) %-*s %f" % (f + 1, 30,
                            feat_labels[sorted_indices[f]],
                            importances[sorted_indices[f]]))
The following will be printed representing the feature importances.
Interpreting feature importance using visualization plot
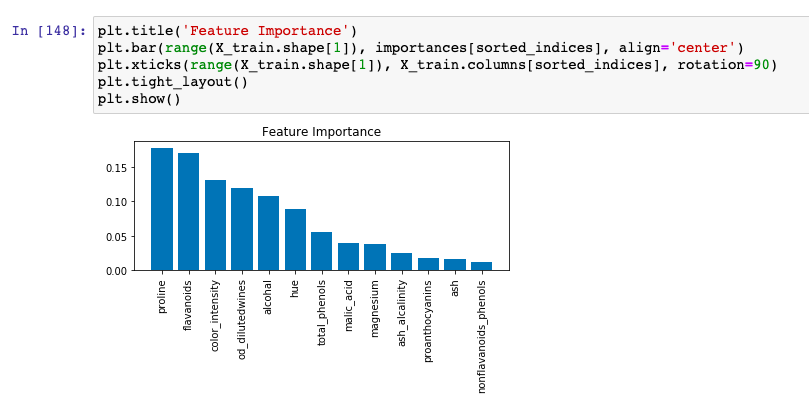
We will create a plot for interpreting feature importance from the output of random forest classifier. With the sorted indices in place, the following python code will help create a bar chart for visualizing feature importance.
import matplotlib.pyplot as plt

plt.title('Feature Importance')
plt.bar(range(X_train.shape[1]), importances[sorted_indices], align='center')
plt.xticks(range(X_train.shape[1]), X_train.columns[sorted_indices], rotation=90)
plt.tight_layout()
plt.show()
Here is how the matplotlib.pyplot visualization plot representing feature importance looks like. Let’s look into how to interpret feature importance using this plot.
Python Sklearn RandomForestRegressor for Feature Importance
The following Python code snippet demonstrates how to extract and visualize feature importance from a Random Forest Regressor using the Boston housing dataset from sklearn. The code begins by importing the necessary modules, loading the dataset, and then splitting it into features and the target variable. A Random Forest Regressor model is instantiated and fitted to the data. The feature_importances_ attribute of the fitted model is used to obtain the importance scores of each feature. These importance scores indicate the relative contribution of each feature to the model’s predictions.
import matplotlib.pyplot as plt
from sklearn.datasets import load_boston
from sklearn.ensemble import RandomForestRegressor

# Load the Boston housing dataset
boston = load_boston()
X, y = boston.data, boston.target

# Create a Random Forest Regressor
rfr = RandomForestRegressor(n_estimators=100, random_state=42)

# Fit the model
rfr.fit(X, y)

# Get feature importances
importances = rfr.feature_importances_
indices = range(len(importances))

# Rearrange feature names so they match the sorted feature importances
names = [boston.feature_names[i] for i in importances.argsort()]

# Plot Feature Importance
plt.figure()
plt.title("Feature Importance with Random Forest Regressor")
plt.barh(indices, sorted(importances), align='center')
plt.yticks(indices, names)
plt.xlabel('Relative Importance')
plt.show()
Interpreting feature importance using visualization plot
We will create a plot for interpreting feature importance from the output of random forest regressor. The following visualization plot plots feature scores for features used in training the model. Let’s look into how to interpret feature importance from this plot.
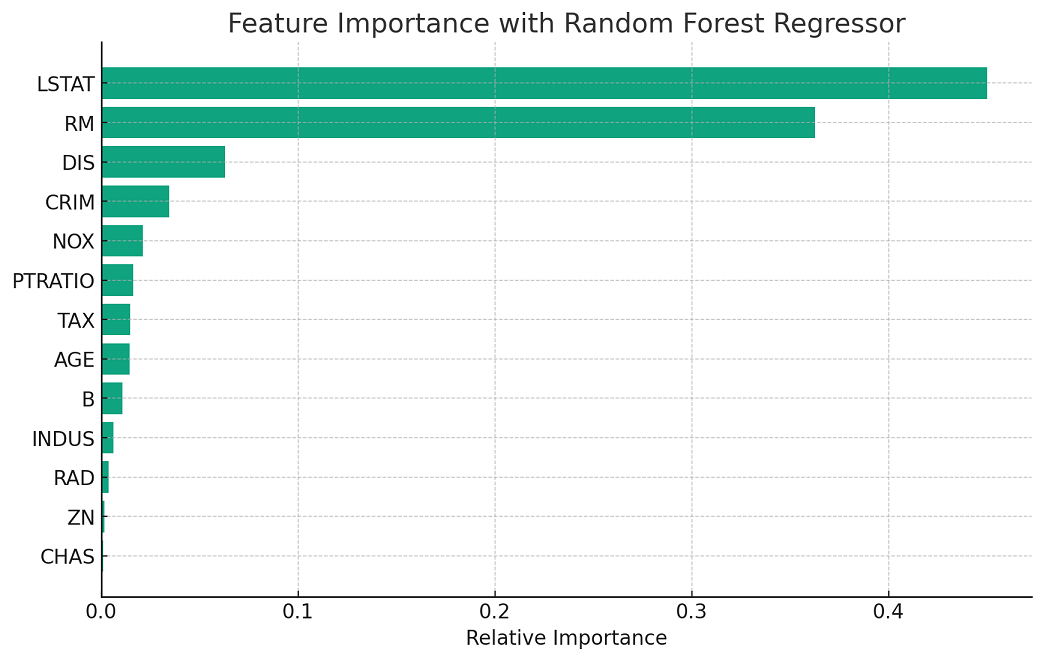
The plot generated above displays the feature importance as determined by a Random Forest Regressor trained on the Boston housing dataset. Each bar represents a feature from the dataset, and the length of the bar signifies the relative importance of that feature in predicting the target variable, which in this case is the median value of owner-occupied homes.
From this plot, we can deduce which features the Random Forest algorithm found most predictive for housing prices. Features with longer bars are deemed more significant by the model and thus have a greater impact on the model’s predictions. For instance, if ‘RM’ (average number of rooms per dwelling) has a long bar, it is considered a strong predictor of housing prices.
However, it’s important to note that while feature importance provides valuable insights, it does not indicate the nature of the relationship between the feature and the target (whether positive or negative) and may not capture dependencies between features. Thus, it should be one of many tools used for model interpretation
Frequently Asked Questions (FAQs)
The following are some of the most common FAQs related to assessing feature importance using random forest algorithms for regression and classification:
- Can feature importance be determined using decision tree model?
- Decision tree models assess feature importance by measuring how much each feature contributes to reducing a criterion like Gini impurity or mean squared error at each node. This importance is aggregated across the tree, with the sum normalized, indicating the relative influence of each feature.
- Can feature importance be found with random forest regression models?
- Yes; Demonstrated in this blog post
- Can feature importance be found with random forest classifier models?
- Yes; Demonstrated in this blog post
- How to use random forest for feature selection?
- To use Random Forest for feature selection, train the model on your dataset and then evaluate the feature importances provided by the model. These importances are based on how much each feature decreases the impurity in the model’s decision trees. Select the most important features based on a threshold or a specific number of top features. This approach helps in identifying the most relevant features for the prediction task.
- How is Gini impurity related with feature importance?
- Gini impurity is a measure used in decision trees, including Random Forests, to quantify how often a randomly chosen element would be incorrectly labeled if it was randomly labeled according to the distribution of labels in the subset. In the context of feature importance, a feature is considered more important if splitting on that feature significantly decreases the Gini impurity in the nodes of the tree. Essentially, a greater decrease in Gini impurity due to a split on a particular feature indicates higher importance of that feature in the decision-making process of the tree. This decrease in impurity is aggregated over all trees in a Random Forest to assess the overall importance of each feature.
- What are different feature importance algorithms?
- Various algorithms assess feature importance in machine learning. Tree-based models like Decision Trees and Random Forests use Gini Importance, based on node impurity reduction. Permutation Feature Importance evaluates the impact of feature shuffling on model performance. Linear model coefficients indicate importance, requiring feature normalization. SHAP and LIME provide advanced, model-agnostic explanations of feature contributions. Principal Component Analysis (PCA) assists in feature reduction, while techniques like layer-wise relevance propagation (LRP) are used in neural networks.

Check out my latest book titled as First Principles Thinking: Building winning products using first principles thinking.
- Mathematics Topics for Machine Learning Beginners - July 6, 2025
- Questions to Ask When Thinking Like a Product Leader - July 3, 2025
- Three Approaches to Creating AI Agents: Code Examples - June 27, 2025
Thanks very useful info easy to understand