Author Archives: Ajitesh Kumar
Python Pickle Security Issues / Risk

Suppose your machine learning model is serialized as a Python pickle file and later loaded for making predictions. In that case, you need to be aware of security risks/issues associated with loading the Python Pickle file. Security Issue related to Python Pickle The Python pickle module is a powerful tool for serializing and deserializing Python object structures. However, its very power is also what makes it a potential security risk. When data is “pickled,” it is converted into a byte stream that can be written to a file or transmitted over a network. “Unpickling” this data reconstructs the original object in memory. The danger lies in the fact that unpickling …
Pricing Analytics in Banking: Strategies, Examples
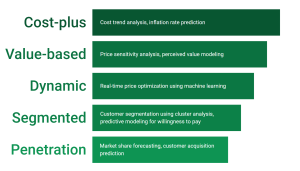
Last updated: 15th May, 2024 Have you ever wondered how your bank decides what to charge you for its services? Or, perhaps how do banks arrive at the pricing (fees, rates, and charges) associated with various banking products? If you’re a product manager, data analyst, or data scientist in the banking industry, you might be aware that these pricing decisions are far from arbitrary. Rather, these pricing decisions are made based on one or more frameworks while leveraging data analytics. They result from intricate pricing strategies, driven by an extensive array of data and sophisticated analytics. In this blog, we will learn about some popular pricing strategies banks execute to …
How to Learn Effectively: A Holistic Approach

In this fast-changing world, the ability to learn effectively is more valuable than ever. Whether you’re a student, a professional (data scientist, software engineer, or business analyst), or simply a curious individual, mastering the art of learning can open doors to new opportunities and deeper understanding. But how does one transcend from merely absorbing information to truly learning it? The key lies in a three-step process that can significantly enhance your learning efficiency and retention: Listening, Thinking, and Meditating on the topic. The three-step learning process—Listening, Thinking, and Meditating—parallels the ancient Vedantic practice of Shravana, Manana, and Nididhyasana. These are the three key pillars through which knowledge is traditionally acquired …
How to Choose Right Statistical Tests: Examples

Last updated: 13th May, 2024 Whether you are a researcher, data analyst, or data scientist, selecting the appropriate statistical test is crucial for accurate and reliable hypothesis testing for validating any given claim. With numerous tests available, it can be overwhelming to determine the right statistical test for your research question and data type. In this blog, the aim is to simplify the process, providing you with a systematic approach to choosing the right statistical test. This blog will be particularly helpful for those new to statistical analysis and unsure which test to use for their specific needs. You will learn a clear and structured method for selecting the appropriate …
Data Lakehouses Fundamentals & Examples
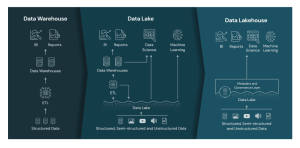
Last updated: 12th May, 2024 Data lakehouses are a relatively new concept in the data warehousing space. They combine the scalability and cost-effectiveness of cloud storage-based data lakes with the flexibility, security, and performance of traditional data warehouses to create a powerful data management solution. But what exactly is a data lakehouse, how does it work, and how might it be used in your organization? In this blog post, we’ll explore the basics of data lakehouses and provide real-world examples to illustrate their value. What is a Data Lakehouse? Simply speaking, data lakehouses combine elements from both data warehouses and data lakes — hence the name “data lakehouse” — to …
Machine Learning Lifecycle: Data to Deployment Example
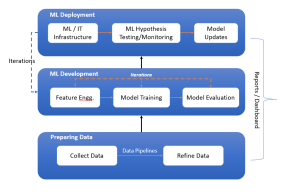
Last updated: 12th May 2024 In this blog, we get an overview of the machine learning lifecycle, from initial data handling to the deployment and iterative improvement of ML models. You might want to check out this book for greater insights into machine learning (ML) concepts – Machine Learning Interviews. The following is the diagram representing the machine learning lifecycle while showcasing three key stages such as preparing data, ML development, and ML deployment. These three stages are explained later in this blog. Stage A: Preparing Data Preparing data for training machine learning models involves collecting data, constructing data pipelines for preprocessing, and refining the data to prepare it for …
Autoencoder vs Variational Autoencoder (VAE): Differences, Example
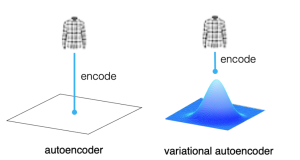
Last updated: 12th May, 2024 In the world of generative AI models, autoencoders (AE) and variational autoencoders (VAEs) have emerged as powerful unsupervised learning techniques for data representation, compression, and generation. While they share some similarities, these algorithms have unique properties and applications that distinguish them. This blog post aims to help machine learning / deep learning enthusiasts understand these two methods, their key differences, and how they can be utilized in various data-driven tasks. We will learn about autoencoders and VAEs, understanding their core components, working mechanisms, and common use cases. We will also try and understand their differences in terms of architecture, objectives, and outcomes. What are Autoencoders? …
Linear Regression T-test: Formula, Example
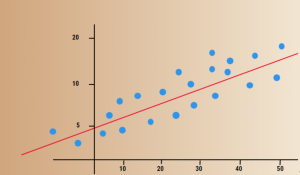
Last updated: 7th May, 2024 Linear regression is a popular statistical method used to model the relationship between a dependent variable and one or more independent variables. In linear regression, the t-test is a statistical hypothesis testing technique used to test the hypothesis related to the linearity of the relationship between the response variable and different predictor variables. In this blog, we will discuss linear regression and t-test and related formulas and examples. For a detailed read on linear regression, check out my related blog – Linear regression explained with real-life examples. T-tests are used in linear regression to determine if a particular independent variable (or feature) is statistically significant …
Feature Engineering in Machine Learning: Python Examples

Last updated: 3rd May, 2024 Have you ever wondered why some machine learning models perform exceptionally well while others don’t? Could the magic ingredient be something other than the algorithm itself? The answer is often “Yes,” and the magic ingredient is feature engineering. Good feature engineering can make or break a model. In this blog, we will demystify various techniques for feature engineering, including feature extraction, interaction features, encoding categorical variables, feature scaling, and feature selection. To demonstrate these methods, we’ll use a real-world dataset containing car sales data. This dataset includes a variety of features such as ‘Company Name’, ‘Model Name’, ‘Price’, ‘Model Year’, ‘Mileage’, and more. Through this …
Feature Selection vs Feature Extraction: Machine Learning

Last updated: 2nd May, 2024 The success of machine learning models often depends on the quality of the features used to train them. This is where the concepts of feature extraction and feature selection come in. In this blog post, we’ll explore the difference between feature selection and feature extraction, two key techniques used as part of feature engineering in machine learning to optimize feature sets for better model performance. Both feature selection and feature extraction are used for dimensionality reduction which is key to reducing model complexity given that higher model complexity often results in overfitting. We’ll provide examples of how they can be applied in real-world scenarios. If …
Model Selection by Evaluating Bias & Variance: Example
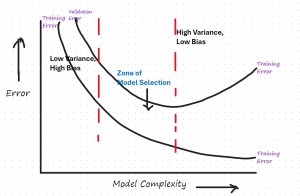
When working on a machine learning project, one of the key challenges faced by data scientists/machine learning engineers is to select the most appropriate model that generalizes well to unseen datasets. To achieve the best generalization on unseen data, the model’s bias and variance need to be balanced. In this post, we’ll explore how to visualize and interpret the trade-off between bias and variance using a residual error vs. model complexity plot. We’ll use a specific plot to guide our discussion. The following is the residual error vs model complexity plot that would need to be drawn for evaluating the model bias vs variance for model selection. We will learn …
Bias-Variance Trade-off in Machine Learning: Examples

Last updated: 1st May, 2024 The bias-variance trade-off is a fundamental concept in machine learning that presents a challenging dilemma for data scientists. It relates to the problem of simultaneously minimizing two sources of residual error that prevent supervised learning algorithms from generalizing beyond their training data. These two sources of error are related to Bias and Variance. Bias-related errors refer to the error due to overly simplistic machine learning models. Variance-related errors refer to the error due to too much complexity in the models. In this post, you will learn about the concepts of bias & variance in the machine learning (ML) models. You will learn about the tradeoff between bias …
Mean Squared Error vs Cross Entropy Loss Function
Last updated: 1st May, 2024 As a data scientist, understanding the nuances of various cost functions is critical for building high-performance machine learning models. Choosing the right cost function can significantly impact the performance of your model and determine how well it generalizes to unseen data. In this blog post, we will delve into two widely used cost functions: Mean Squared Error (MSE) and Cross Entropy Loss. By comparing their properties, applications, and trade-offs, we aim to provide you with a solid foundation for selecting the most suitable loss function for your specific problem. Cost functions play a pivotal role in training machine learning models as they quantify the difference …
Cross Entropy Loss Explained with Python Examples
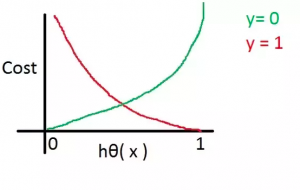
Last updated: 1st May, 2024 In this post, you will learn the concepts related to the cross-entropy loss function along with Python code examples and which machine learning algorithms use the cross-entropy loss function as an objective function for training the models. Cross-entropy loss represents a loss function for models that predict the probability value as output (probability distribution as output). Logistic regression is one such algorithm whose output is a probability distribution. You may want to check out the details on how cross-entropy loss is related to information theory and entropy concepts – Information theory & machine learning: Concepts What’s Cross-Entropy Loss? Cross-entropy loss, also known as negative log-likelihood …
Gradient Descent in Machine Learning: Python Examples
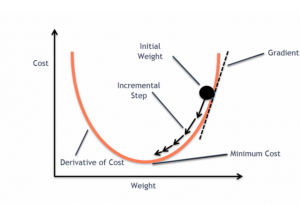
Last updated: 22nd April, 2024 This post will teach you about the gradient descent algorithm and its importance in training machine learning models. For a data scientist, it is of utmost importance to get a good grasp on the concepts of gradient descent algorithm as it is widely used for optimizing/minimizing the objective function / loss function / cost function related to various machine learning models such as regression, neural network, etc. in terms of learning optimal weights/parameters. This algorithm is essential because it underpins many machine learning models, enabling them to learn from data by optimizing their performance. Introduction to Gradient Descent Algorithm The gradient descent algorithm is an optimization …
Loss Function vs Cost Function vs Objective Function: Examples

Last updated: 19th April, 2024 Among the terminologies used in training machine learning models, the concepts of loss function, cost function, and objective function often cause a fair amount of confusion, especially for aspiring data scientists and practitioners in the early stages of their careers. The reason for this confusion isn’t unfounded, as these terms are similar / closely related, often used interchangeably, and yet, they are different and serve distinct purposes in the realm of machine learning algorithms. Understanding the differences and specific roles of loss function, cost function, and objective function is more than a mere exercise in academic rigor. By grasping these concepts, data scientists can make …
I found it very helpful. However the differences are not too understandable for me