Author Archives: Ajitesh Kumar
NLP: Different Types of Language Models – Examples

Have you ever wondered how your smartphone seems to know exactly what you’re going to type next? Or how virtual assistants like Alexa and Siri understand and respond to your queries with such precision? The magic is NLP language models. In this blog, we will explore the diverse types of language models in NLP that have evolved over time, each with its unique capabilities and applications. From the simplicity of N-gram models, which predict text based on preceding words, to the sophisticated neural network-based models like RNNs, LSTMs, and the groundbreaking large language models using Transformers, we will learn about the intricacies of these models, examples of real-world applications and …
Bag of Words in NLP & Machine Learning: Examples

Last updated: 6th Jan, 2024 Most machine learning algorithms require numerical input for training the models. Bag of words (BoW) effectively converts text data into numerical feature vectors, making it compatible with a wide range of machine learning algorithms, from linear classifiers like logistic regression to complex ones like neural networks. In this post, you will learn about the concepts of bag-of-words model and how to train a text classification model using Python Sklearn. Some of the most common text classification problems includes sentiment analysis, spam filtering etc. In these problems, one can apply bag-of-words technique to train machine learning models for text classification. It will be good to understand the …
Innovative Thinking: Methods & Examples

Innovative thinking is a multifaceted approach that leverages different styles of thinking to tackle problems and generate groundbreaking solutions. It encompasses first principles thinking, which digs down to the foundational elements of an issue, analytical thinking that systematically dissects a problem into smaller, more manageable parts, critical thinking that involves evaluating and judging the information and ideas at hand, and infinite thinking, which pushes the boundaries of imagination to consider limitless possibilities. Each of these styles contributes uniquely to the process of innovation, offering a comprehensive toolkit for tackling challenges in novel and effective ways. In this blog, we’ll delve deeper into each of these styles, exploring how they individually …
Natural Language Processing (NLP) Task Examples
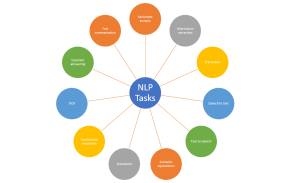
Last updated: 5th Jan, 2024 Have you ever wondered how your phone’s voice assistant understands your commands and responds appropriately? Or how search engines are able to provide relevant results for your queries? The answer lies in Natural Language Processing (NLP), a subfield of artificial intelligence (AI) that focuses on enabling machines to understand and process human language. NLP is becoming increasingly important in today’s world as more and more businesses are adopting AI-powered solutions to improve customer experiences, automate manual tasks, and gain insights from large volumes of textual data. With recent advancements in AI technology, it is now possible to use pre-trained language models such as ChatGPT to …
Cohen Kappa Score Explained: Formula, Example
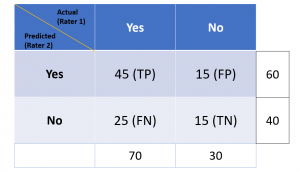
Last updated: 5th Jan, 2024 Cohen’s Kappa Score is a statistic used to measure the performance of machine learning classification models. In this blog post, we will discuss what Cohen’s Kappa Score is and Python code example representing how to calculate Kappa score using Python. We will also provide a code example so that you can see how it works! What is Cohen’s Kappa Score or Coefficient? Cohen’s Kappa Score, also known as the Kappa Coefficient, is a statistical measure of inter-rater agreement for categorical data. Cohen’s Kappa Coefficient is named after statistician Jacob Cohen, who developed the metric in 1960. It is generally used in situations where there …
Validation Techniques for Machine Learning Models: Examples
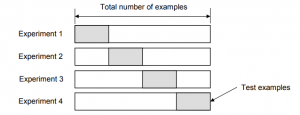
Last updated: 4th Jan, 2024 In the realm of machine learning, the emphasis increasingly shifts towards solving real-world problems with high-quality models. Creating high performant models does not not just depend on raw computational power or theoretical knowledge, but crucially on the ability to systematically conduct and learn from a myriad of different models by trying with hypothesis and related experiments including different algorithms, datasets / features, hyperparameters, etc. This is where the importance of a robust validation strategy and related techniques becomes paramount. Validation techniques, in essence, are the methodologies employed to accurately assess a model’s errors and to gauge how its performance fluctuates with different experiments. The primary …
Machine Learning Definition, Examples, Method, Types
Last updated: 3rd Jan, 2024 Machine learning is a machine’s ability to learn from data. It has been around for decades, but machine learning is now being applied in nearly every industry and job function. In this blog post, we’ll cover a detailed introduction to what is machine learning (ML) including different definitions. We will also learn about different types of machine learning tasks, algorithms, etc along with real-world examples. What is machine learning & how does it work? Definition 1: Simply speaking, machine learning can be defined as an approach to model our beliefs about real-world events. For example, let’s say a person came to a doctor with a …
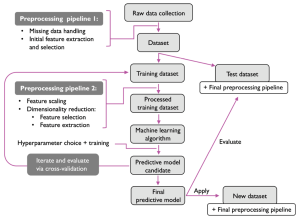
Machine Learning Models Solution Design: Examples

This blog is crafted for data scientists, machine learning (ML) and software engineers, business analysts / product managers, and anyone involved in the ML project lifecycle, aiming to create a reliable solution design and development strategy / plan for successful AI / machine learning project implementation and value realization. The blog revolves around a series of critical solution design questions, meticulously curated to guide teams from the initial conception of a project to its final deployment and beyond. By addressing each of these solution design questions, teams can ensure that they are not only building a model that is technically proficient but also one that aligns seamlessly with business objectives, …
Micro-average, Macro-average, Weighting: Precision, Recall, F1-Score
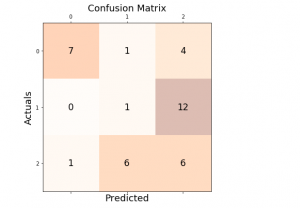
Last updated: 30th Dec, 2023 In this post, you will learn about how to use micro-averaging and macro-averaging methods for evaluating scoring metrics (precision, recall, f1-score) for multi-class classification machine learning problem. You will also learn about weighting method used as one of the other averaging choices of metrics such as precision, recall and f1-score for multi-class classification problem. The concepts will be explained with Python code examples. What & Why of Micro, Macro-averaging and Weighting metrics? Micro and macro-averaging methods are used in the evaluation of classification models, to compute performance metrics like precision, recall, and F1-score. These methods are especially relevant in scenarios involving multi-class or multi-label classification. In case of multi-class classification, …
Mean Squared Error or R-Squared – Which one to use?
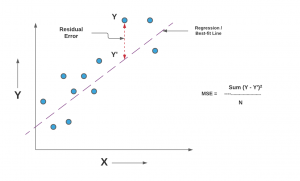
Last updated: 29th Dec, 2023 As you embark on your journey to understand and evaluate the performance of regression models, it’s crucial to know when to use each of these metrics and what they reveal about your model’s accuracy. In this post, you will learn about the concepts of the mean-squared error (MSE) and R-squared (R2), the difference between them, and which one to use when evaluating the linear regression models. Note that MSE is very closely related to root mean squared error (RMSE) which is also discussed in this blog. You also learn Python examples to understand the concepts in a better manner. For learning the differences between other …
Data Science Competitions on Different Online Platforms

Data science / Machine Learning is an ever-evolving field, and competitions provide a great way for beginners / practitioners to hone their skills, solve real-world problems, enhance their resumes / CVs and even earn rewards. Here’s a roundup of some notable machine learning / data science / AI competition platforms, each offering unique opportunities. Each of these data science competition platforms offers unique opportunities and challenges, making them ideal for both beginners and expert data scientists at various stages of their careers to learn, compete, and contribute to a wide array of problems.
Mastering Data Quality KPI Dashboards: Concepts, Examples

In the digital age, where data is often likened to the new oil, ensuring its quality is not just an operational necessity but a strategic imperative. In every organization, from small startups to global enterprises, the ability to trust and accurately interpret data can be the difference between insightful business decisions and costly missteps. This is where data quality Key Performance Indicators (KPIs) and their visualization through dashboards become pivotal. In this blog, we aim to navigate you through the multifaceted world of data quality, focusing on understanding, designing, and implementing effective KPI dashboards. Whether you’re a data analyst, a business intelligence professional, or just someone passionate about data-driven decision-making, …
Large Language Models (LLMs) & Semantic Search: Examples
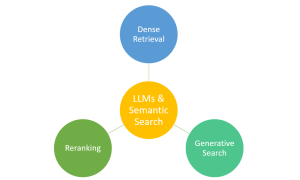
Have you ever marveled at how typing a few words into a search engine yields exactly the information you’re looking for from the vast expanse of the web? This is largely thanks to the advancements in semantic search, bolstered by technologies like Large Language Models (LLMs). Semantic search, which focuses on understanding the intent and contextual meaning behind queries, benefits from LLMs to provide more accurate and relevant results. However, it’s important to note that traditional search engines also rely on a sophisticated mix of algorithms, indexing, and ranking systems. LLMs complement these systems by enhancing their ability to interpret complex queries, making your search experience more intuitive and effective. …
Online Scatter Plot Maker – Works with Your Excel Data
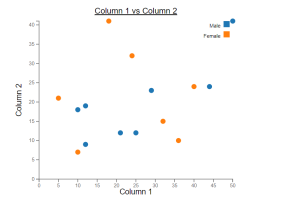
This online free tool, scatter plot creator, is designed to make data scatter plot visualization simpler, more efficient, and more integrated into your reporting. Scatter plots are invaluable for examining the relationship between two variables, identifying trends, outliers, and patterns. Whether you’re a data scientist, researcher, or data enthusiast, this tool will enable you to visualize your data effectively using scatter plots. The following are key features of this online scatter plot maker tool: Create Scatter Plots
Independent Samples T-test: Formula, Examples, Calculator
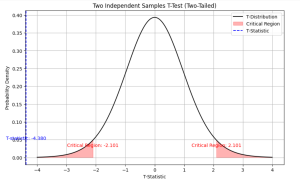
Last updated: 21st Dec, 2023 As a data scientist, you may often come across scenarios where you need to compare the means of two independent samples. In such cases, a two independent samples t-test, also known as unpaired two samples t-test, is an essential statistical tool that can help you draw meaningful conclusions from your data. This test allows you to determine whether the difference between the means of two independent samples is statistically significant or due to chance. In this blog, we will cover the concept of independent samples t-test, its formula, real-world examples of its applications and the Python & Excel example (using scipy.stats.ttest_ind function). We will begin …
Introducing Our New Data Science & AI Trends Page

We are thrilled to announce the launch of our dedicated Data Science and AI Trends page at VitalFlux.com! This new resource is designed to be a one-stop hub for data scientists, AI enthusiasts, and anyone passionate about staying at the forefront of technological innovation. What You’ll Find Our Data Science & AI Trends page is more than just a collection of articles; it’s a dynamic resource that aggregates the most insightful and current information from various high-impact sources. Here’s a sneak peek at what you can expect: Web Pages Stay informed with our selection of web pages from leading research institutions, tech news outlets, and individual thought leaders in the …
I found it very helpful. However the differences are not too understandable for me