When working on a machine learning project, one of the key challenges faced by data scientists/machine learning engineers is to select the most appropriate model that generalizes well to unseen datasets. To achieve the best generalization on unseen data, the model’s bias and variance need to be balanced. In this post, we’ll explore how to visualize and interpret the trade-off between bias and variance using a residual error vs. model complexity plot. We’ll use a specific plot to guide our discussion.
The following is the residual error vs model complexity plot that would need to be drawn for evaluating the model bias vs variance for model selection.

We will learn about how to create this plot and then how to use this plot for model selection.
Creating Model Error vs Complexity Plot
The following steps can be followed to create the model error vs complexity plot:
- Data Collection: Gather a sufficiently large dataset to train and validate the models.
- Model Training: Train several models of increasing complexity. This could mean increasing the number of parameters, the layers in a neural network, or the degree of a polynomial in regression.
- Error Calculation: Compute the training and validation errors for each model. Training error is calculated on the same data used for training, while validation error is calculated on a separate set.
- Plotting: Plot both errors against the model complexity. Use different markers or lines for training and validation errors to clearly distinguish them.
Understanding the Plot
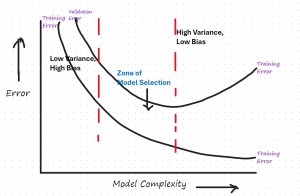
The plot in question shows two curves: the training error and the validation error as functions of model complexity. Here’s what each element represents:
- Training Error: This curve typically decreases as model complexity increases. More complex models can capture more subtle patterns in the training data.
- Validation Error: This curve usually decreases initially as model complexity increases but starts increasing after a point, indicating overfitting.
- Bias: This is the error introduced by approximating a real-world problem by a much simpler model. It is high when the model is too simple.
- High bias can cause an algorithm to miss the relevant relations between features and target outputs (i.e., the signal), assuming that simple linear relations exist when they don’t. Essentially, a high-bias model is not complex enough to learn from the data adequately. It tends to oversimplify the model, which does not learn well from the training data and hence, performs poorly even on new data. A high-bias model is also said to be underfitted.
- Low bias indicates that the model assumptions allow it to fit the training data very well. It can accurately capture the underlying relationships and is flexible enough to learn subtle patterns, including complex relationships in the data.
- Variance: This is the error due to excessive complexity in the model, which leads to high sensitivity to small fluctuations in the training set. Model variance refers to the amount by which the model estimate would change if you estimate it using a different training data set.
- High variance suggests that the model’s predictions change significantly with different training data, indicating that the model is highly sensitive to the specific noises and idiosyncrasies of the training data. This sensitivity results in a model that fits the training data extremely well—sometimes too well by capturing random noise as if it were meaningful patterns. A high variance model is also said to be overfitted.
- Low variance suggests that the model’s estimates for the outputs (predictions) will not vary much if trained on a different set of training data from the same population. In the context of a high-bias model, low variance indicates that the model consistently makes the same kinds of errors in predictions, irrespective of small changes in the training dataset.
Evaluating Model Bias vs Variance Zones
Once the model error vs complexity plot is created, the next step is to identify and evaluate key zones in the plot related to model bias vs variance.
- Low Variance, High Bias: At the left end of the plot, where model complexity is low, both training and validation errors are high due to underfitting.
- High Variance, Low Bias: At the right end, the model complexity is too high. The training error is low, but the validation error is high due to overfitting.
- Zone of Model Selection: This is the sweet spot where the validation error is at its minimum and the model generalizes well to new data. The key is to select a model in this region.
There are scenarios when you can also opt for selecting models in either high bias/low variance zone or low bias/high variance zone. The following can be some of them:
- Less Variability Desired: When the goal is to minimize the variance in predictions, especially in scenarios where maintaining consistency across different datasets or subsets of data is crucial, you might go for selecting model with higher bias and lower variance. Also, at times, when interpretability is a key requirement, one opts for such models.
- Complex Relationships in Data: When the data contains complex patterns that simpler models cannot capture. High variance models (like deep learning models and non-linear ensemble methods) can learn these subtleties and achieve higher performance on complex tasks.
- Accuracy is Paramount: In applications where performance, measured by metrics like accuracy, precision, and recall, is more critical than model interpretability. High-variance models often perform better on such metrics.
Conclusion
Selecting the right model involves understanding how different models behave as their complexity changes. By carefully analyzing the training and validation errors as you adjust the complexity, you can select a model that neither underfits (high bias, low variance) nor overfits (low bias, high variance), thus ensuring better performance on unseen data.

Check out my latest book titled as First Principles Thinking: Building winning products using first principles thinking.
- Mathematics Topics for Machine Learning Beginners - July 6, 2025
- Questions to Ask When Thinking Like a Product Leader - July 3, 2025
- Three Approaches to Creating AI Agents: Code Examples - June 27, 2025
I found it very helpful. However the differences are not too understandable for me