Author Archives: Ajitesh Kumar
When to Use ChatGPT O1 Model

Knowing when to use the LLM such as the ChatGPT O1 model is key to unlocking its full potential. For example, the O1 model is particularly beneficial in scenarios such as analyzing large datasets for patterns in genomics, designing experiments to test novel chemical reactions, or creating algorithms to optimize workflows in computational biology. These applications highlight its ability to address diverse and intricate challenges. Designed to address complex, multifaceted challenges, the O1 model shines when diverse expertise—spanning data analysis, experimental design, coding, and beyond—is required. Let’s delve into these capabilities to understand when and how they can be effectively applied to drive groundbreaking advancements across various fields. Data Analysis …
Agentic Reasoning Design Patterns in AI: Examples
In recent years, artificial intelligence (AI) has evolved to include more sophisticated and capable agents, such as virtual assistants, autonomous robots, and conversational large language models (LLMs) agents. These agents can think, act, and collaborate to achieve complex goals. Agentic Reasoning Design Patterns help explain how these agents work by outlining the essential strategies that AI agents use for reasoning, decision-making, and interacting with their environment. What is an AI Agent? An AI agent, particularly in the context of LLM agents, is an autonomous software entity capable of perceiving its environment, making decisions, and taking actions to achieve specific goals. LLMs enable these agents to understand natural language and reason …
LLMs for Adaptive Learning & Personalized Education
Adaptive learning helps in tailoring learning experiences to fit the unique needs of each student. In the quest to make learning more personalized, Large Language Models (LLMs) with their capability to understand and generate human-like text, offer unprecedented opportunities to adaptively support and enhance the learning process. In this blog, we will explore how adaptive learning can leverage LLMs by integrating Knowledge Tracing (KT), Semantic Representation Learning, and Automated Knowledge Concept Annotation to create a highly personalized and effective educational experience. What is Adaptive Learning? Adaptive learning refers to a method of education that levereges technology to adjust the type and difficulty of learning content based on individual student performance. …
Sparse Mixture of Experts (MoE) Models: Examples
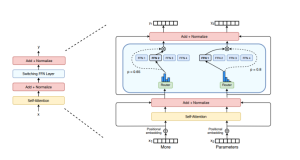
With the increasing demand for more powerful machine learning (ML) systems that can handle diverse tasks, Mixture of Experts (MoE) models have emerged as a promising solution to scale large language models (LLM) without the prohibitive costs of computation. In this blog, we will delve into the concept of MoE, its history, challenges, and applications in modern transformer architectures, particularly focusing on the role of Google’s GShard and Switch Transformers. What is a Mixture of Experts (MoE) Model? Mixture of Experts (MoE) model represents a neural network architecture that divides a model into multiple sub-components (neural network) called experts. Each expert is designed to specialize in processing specific types of …
Anxiety Disorder Detection & Machine Learning Techniques

Anxiety is a common mental health condition that affects millions of people around the world. Characterized by excessive worry, fear, and apprehension about everyday situations, anxiety can significantly impact a person’s quality of life. Traditional diagnosis of anxiety largely relies on subjective assessments, including self-reports and clinical observations, which can often be unreliable. In recent years, machine learning has emerged as a promising solution to address the challenges in detecting anxiety disorders with greater accuracy and objectivity. In this blog, we will learn about how machine learning models can be used for detecting anxiety disorders and what kind of data and ML algorithms can be used. The Challenge of Diagnosing …
Confounder Features & Machine Learning Models: Examples
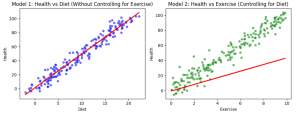
In machine learning, confounder features or variables can significantly affect the accuracy and validity of your model. A confounder feature is a variable that influences both the predictor and the outcome or response variables, creating a false impression of causality or correlation. This makes it harder to determine whether the observed relationship between two variables is genuine or merely due to some external factor. Example of Confounder Features For instance, consider a model that predicts a person’s likelihood of heart disease based on their diet. You may conclude that people eating a balanced diet are less likely to have heart disease, but this relationship could be confounded by exercise habits. …
Credit Card Fraud Detection & Machine Learning

Last updated: 26 Sept, 2024 Credit card fraud detection is a major concern for credit card companies. With credit cards so prevalent in our society, credit card companies must be able to prevent fraud happening with credit card transactions and protect their customers. Machine learning techniques can provide a powerful and effective way of detecting fraud happening with transactions done using credit cards. In this blog post we will discuss ML techniques that data scientists can use to design appropriate fraud detection solutions including algorithms such as Bayesian networks, support vector machines, neural networks and decision trees. What are different types of credit card fraud? The following are different types …
Neural Network Types & Real-life Examples
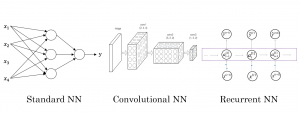
Last updated: 24th Sept, 2024 Neural networks are a powerful tool for data scientists, machine learning engineers, and statisticians. They have revolutionized the field of deep learning and have become an integral part of many real-world applications such as image and speech recognition, natural language processing (NLP), autonomous vehicles, etc. ChatGPT is a classic example how neural network applications has taken world by storm. But what exactly are they and what are their different types? Understanding the different types of neural networks and their real-life examples is crucial. In this blog post, we’ll explore different types of neural networks (ANN, CNN, RNN, LSTM, etc.) , provide real-life examples of how …
Invoke Python ML Models from Other Applications – Examples
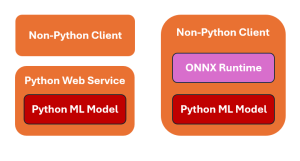
When working with Python-based machine learning models, a common question that pops up is how do we invoke models written in Python from apps written in other languages? The picture below represents two strategies for invoking Python machine learning models from client applications written using other programming languages such as Java, C++, C#, etc. The following is explanation for the above: Sample Flask Code for Python Web Service The following is the sample Python Flask application to work with a pre-trained ML model saved as model.pkl (pickle file). Non-python client can invoke this webservice appropriately. The model is loaded once when the server starts, ensuring efficient use of resources. The …
Principal Component Analysis (PCA) & Feature Extraction – Examples

Last updated: 17 Sept, 2024 Principal component analysis (PCA)is a dimensionality reduction technique that reduces the number of dimensions or features in a dataset without sacrificing a lot of information. What if it is told that you could take a dataset with 500 columns, use PCA to reduce it to 50 columns, and still able to retain 90% or more of the information in the original dataset? Wouldn’t that sound like a miracle? In this post, you will learn about how to use PCA for extracting important features (also termed as feature extraction technique) from a list of given features. As a machine learning / data scientist, it is very …
Content-based Recommender System: Python Example

In this blog, we will learn about how to implement content-based recommender system using Python programming example. We will learn with the example of movie recommender system for recommending movies. Download the movies data from here to work with example given in this blog. The following is a list of key activities we would do to build a movie recommender system based on content-based recommendation technique. Data loading & preparation Text vectorization Cosine similarity computation Getting recommendations Data Loading & Preparation To start with, we import the data in csv format. Once data is imported, next step is analyse and prepare data before we apply modeling techniques. The dataset contains …
Recommender Systems in Machine Learning: Examples
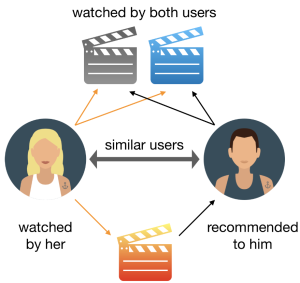
Last updated: 16th Sep, 2024 Recommender systems are widely used in applications such as personalized content recommendation (e.g., movies, books, music), online shopping, and social media. One common example of a recommender system is Netflix. Netflix uses a sophisticated recommender system to suggest movies and TV shows that a user may want to watch. The recommendation algorithm takes into account past user behavior, such as ratings, viewing history, and interactions with content (e.g., likes, watch time). Recommender systems typically leverage techniques such as collaborative filtering, content-based filtering, or hybrid methods that combine both approaches. These systems analyze patterns in user behavior, item attributes, and sometimes additional context, such as demographics …
Difference: Binary vs Multiclass vs Multilabel Classification

Last updated: 13th Sep, 2024 There are three main types of classification algorithms when dealing with machine learning classification problems: Binary, Multiclass, and Multilabel. In this blog post, we will discuss the differences between them and how they can be used to solve different classification problems. Binary classifiers can only classify data into two categories, while multiclass classifiers can classify data into more than two categories. Multilabel classifiers assign or tag the data to zero or more categories. Let’s take a closer look at each type! Binary classification & examples Binary classification is used to represent classification technique in supervised machine learning in which data is classified into two mutually …
Sklearn LabelEncoder Example – Single & Multiple Columns

Last updated: 13 Sept, 2024 In this post, you will learn about the concept of encoding such as Label Encoding used for encoding categorical features while training machine learning models. Label encoding technique is implemented using sklearn LabelEncoder. You would learn the concept and usage of sklearn LabelEncoder using code examples, for handling encoding labels related to categorical features of single and multiple columns in Python Pandas Dataframe. The following are some of the points which will get covered: Background When working with dataset having categorical features, you come across two different types of features such as the following. Many machine learning algorithms require the categorical data (labels) to be …
ROC Curve & AUC Explained with Python Examples
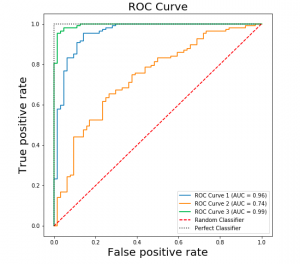
Last updated: 8th Sep, 2024 Confusion among data scientists regarding whether to use ROC Curve / AUC, or, Accuracy / precision / recall metrics for evaluating classification models often stems from misunderstanding ROC Curve / AUC concepts. The ROC Curve visualizes true positive vs false positive rates at various thresholds, while AUC quantifies the overall ability of a model to discriminate between classes, with higher values indicating better performance. In this post, you will learn about ROC Curve and AUC concepts along with related concepts such as True positive and false positive rate with the help of Python examples. It is very important to learn ROC, AUC and related concepts as it …
Accuracy, Precision, Recall & F1-Score – Python Examples
Last updated: 27th Aug, 2024 Classification models are used in classification problems to predict the target class of the data sample. The classification machine learning models predicts the probability that each instance belongs to one class or another. It is important to evaluate the model performance in order to reliably use these models in production for solving real-world problems. The model performance metrics include accuracy, precision, recall, and F1-score. In this blog post, we will explore these classification model performance metrics such as accuracy, precision, recall, and F1-score through Python Sklearn example. As a data scientist, you must get a good understanding of concepts related to the above in relation to …
I found it very helpful. However the differences are not too understandable for me