
Probability distributions are an essential concept in statistics and data analysis. They describe the likelihood of different outcomes or events occurring and provide valuable insights into the characteristics of a given data set. Skewness is an important aspect of probability distributions that can have a significant impact on data analysis and decision-making. In this blog, we will focus on positively skewed probability distributions and explore some real-life examples where these distributions occur. We will discuss what a positively skewed distribution is, what are its different types with formula and definitions. By the end of this blog, you will have a better understanding of positively skewed distributions and be able to recognize them in different contexts.
What is Positive / Right Skewed Distribution?
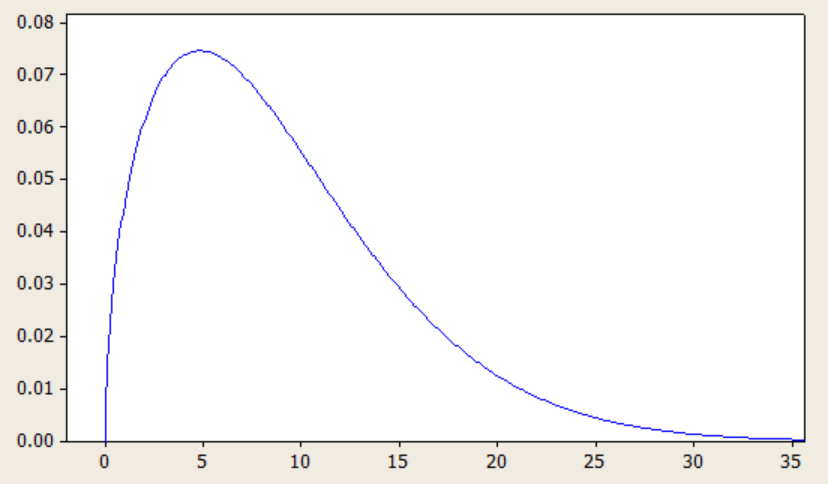
A positively skewed distribution is a type of probability distribution where the majority of the data is concentrated on the left-hand side of the distribution, while the tail extends towards the right-hand side. This means that the distribution is not symmetrical, and the mean of the data is typically greater than the median. Here is a sample plot of positively or right skewed distribution:
Here are few real-life examples of positively skewed distributions:
- Income: Income distribution is often positively skewed. Most people earn an average salary, but a few high earners make a substantial amount of money. The distribution of income is skewed to the right, with a few wealthy individuals on the far right of the distribution.
- Hospital stay length: The length of hospital stays is often positively skewed because most patients are discharged within a few days, but a few patients with severe illnesses or injuries may require a much longer stay.
- Stock returns: The distribution of stock returns is often positively skewed, with a few stocks generating very high returns and many more stocks generating lower returns.
How are positively skewed distributions different from other types?
Positively skewed distributions differ from other types of distributions, such as normal distributions and negatively skewed distributions.
- Symmetry & Skewness: A positively skewed distribution is asymmetrical and skewed towards the right-hand side of the distribution, with the majority of data points on the left-hand side of the peak or mode. In contrast, a normal distribution is symmetrical, with data points distributed evenly around the mean, and has zero skewness. A negatively skewed distribution is also asymmetrical but is skewed towards the left-hand side of the distribution, with the majority of data points on the right-hand side of the peak or mode.
- Measures of central tendency: The measures of central tendency (mean, median, and mode) are different in each type of distribution. In a positively skewed distribution, the mean is greater than the median, which is greater than the mode. In a normal distribution, the mean, median, and mode are all equal. In a negatively skewed distribution, the mode is greater than the median, which is greater than the mean.
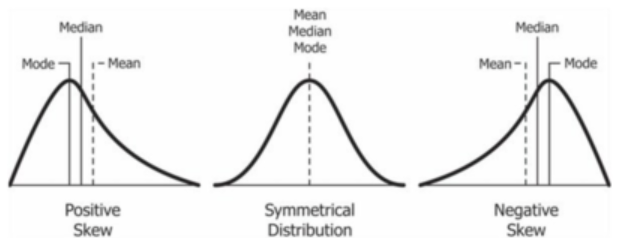
- Shape & Characteristics: The shape and characteristics of the tails of each distribution differ. In a positively skewed distribution, the tail is longer on the right-hand side of the peak, with fewer data points in the tail compared to a normal distribution. In a negatively skewed distribution, the tail is longer on the left-hand side of the peak, with fewer data points in the tail compared to a normal distribution.
List of Positively / Right Skewed Distributions
Here is the table representing some most commonly used positively skewed distribution.
| Distribution | Parameters | Formula (LaTeX) | Definition |
|---|---|---|---|
| Lognormal | [latex]\mu[/latex] (mean of the logarithm of the variable), [latex]\sigma[/latex] (standard deviation of the logarithm of the variable) | [latex]f(x) = \frac{1}{x \sigma \sqrt{2\pi}} e^{-\frac{(\ln x – \mu)^2}{2\sigma^2}}[/latex] | A continuous probability distribution of a random variable whose logarithm is normally distributed. It has a long tail on the right side of the distribution, leading to positive skewness. |
| Weibull | [latex]\lambda[/latex] (scale parameter), [latex]k[/latex] (shape parameter) | [latex]f(x) = \frac{k}{\lambda} (\frac{x}{\lambda})^{k-1} e^{-(\frac{x}{\lambda})^k}[/latex] | A continuous probability distribution that models the time to failure of a system or component. It has a long tail on the right side of the distribution, leading to positive skewness. |
| Exponential | [latex]\lambda[/latex] (rate parameter) | [latex]f(x) = \lambda e^{-\lambda x}[/latex] | A continuous probability distribution that models the time between events in a Poisson process. It has a long tail on the right side of the distribution, leading to positive skewness. |
| Chi-squared | [latex]k[/latex] (degrees of freedom) | [latex]f(x) = \frac{1}{2^{k/2} \Gamma(k/2)} x^{k/2-1} e^{-x/2}[/latex] | A continuous probability distribution that models the sum of squares of k independent standard normal random variables. It has a long tail on the right side of the distribution, leading to positive skewness. |
| Gamma | [latex]\alpha[/latex] (shape parameter), [latex]\beta[/latex] (scale parameter) | [latex]f(x) = \frac{\beta^\alpha}{\Gamma(\alpha)} x^{\alpha-1} e^{-\beta x}[/latex] | A continuous probability distribution that models the time to the nth event in a Poisson process. It has a long tail on the right side of the distribution, leading to positive skewness. |
| Pareto | [latex]x_{min}[/latex] (minimum value), [latex]\alpha[/latex] (shape parameter) | [latex]f(x) = \frac{\alpha x_{min}^\alpha}{x^{\alpha+1}}[/latex] | A continuous probability distribution that models the distribution of wealth, income, or any other quantity where a few individuals or entities possess most of the quantity. It has a very long tail on the right side of the distribution, leading to extreme positive skewness. |
| Beta | [latex]\alpha[/latex] (shape parameter), [latex]\beta[/latex] (shape parameter) | [latex]f(x) = \frac{x^{\alpha-1}(1-x)^{\beta-1}}{B(\alpha,\beta)}[/latex] | A continuous probability distribution that models the probability distribution of probabilities themselves. It is used in Bayesian statistics and can be used to model a wide range of phenomena. Depending on the values of the parameters, it can have either positive or negative skewness, but it can have a long tail on the right side of the distribution when [latex]\alpha > \beta[/latex], leading to positive skewness. |
Conclusion
Positively skewed probability distributions play a crucial role in data analysis and decision-making in many fields, from finance to healthcare. We have explored what a positively skewed distribution is, how it differs from other types of distributions, and how it can be measured using the skewness coefficient. We have also looked at some real-life examples of positively skewed distributions, such as income, stock returns, hospital stay length, and more. It is worth noting that there are several types of probability distributions that are positively skewed, each with their own unique characteristics and applications. For example, the Weibull distribution and the gamma distribution are both positively skewed and commonly used in reliability analysis and engineering. Understanding the properties of positively skewed distributions is essential for data analysis, as it can help us to identify outliers and make more informed decisions based on the shape and characteristics of the data. If you want to learn more, please feel free to drop a message.

Check out my latest book titled as First Principles Thinking: Building winning products using first principles thinking.
- Mathematics Topics for Machine Learning Beginners - July 6, 2025
- Questions to Ask When Thinking Like a Product Leader - July 3, 2025
- Three Approaches to Creating AI Agents: Code Examples - June 27, 2025
I found it very helpful. However the differences are not too understandable for me