Last updated: 18th Dec, 2023
Have you ever wondered what the difference between standard deviation of population and a sample? Or why and when it’s important to measure the standard deviation of both? In this blog post, we will explore what standard deviation is, the differences between the standard deviation of population and samples, and how to calculate their values using their formula and Python code example. By the end of this post, you should have a better understanding of standard deviation in general and why it’s important to calculate it for both populations and samples. Check out my related post – coefficient of variation vs standard deviation.
What is Standard Deviation?
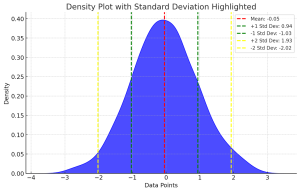
The standard deviation (SD) is a measure of variability of data distribution. It is used to measure how spread out the data is. It is used to measure variability of both population and sample data. The plot below showcases the concept of standard deviation of a normally distributed dataset. Look for 1 and 2 (larger) standard deviations on both sides of means.

# Formula
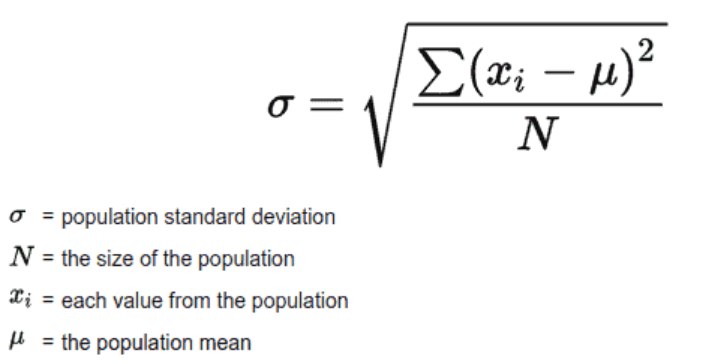
The formula of standard deviation for population is following:
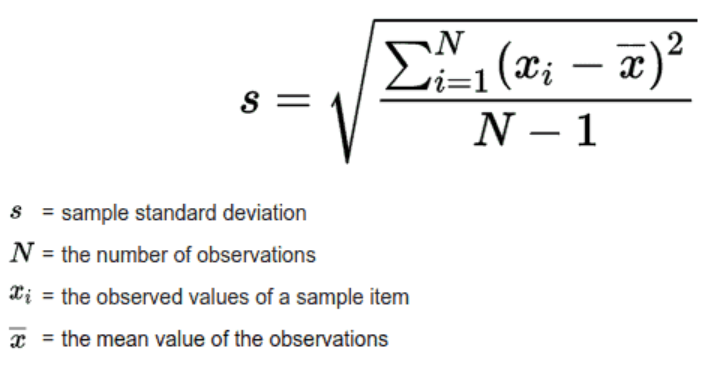
The formula of standard deviation for the sample is following. For calculating the standard deviation of a sample of data (by default in the following method), the Bessel’s correction is applied to the size of the data sample (N) as a result of which 1 is subtracted from the sample size (such as N – 1). The idea is that the calculation of standard deviation of sample includes a little bias due to the fact that the deviation is calculated based on the sample mean rather than the population mean. Thus, the bias is removed by subtracting 1 from the sample size.
# Examples & Python Code
Take a look at the following example using two different samples of 4 numbers whose mean are same but the standard deviation (data spread) are different.
arr1 = [10, 16, 8, 22]
arr2 = [12, 18, 12, 14]
Here is the code for calculating the mean of the above sample. One can either write Python code for calculating the mean or use statistics library methods such as mean. The mean of the above two samples comes out to be 14.
from statistics import mean
#
# Calculate mean
#
mean(arr1), mean(arr2)
#
# Custom code in Python for calculating the mean
#
def mean(arr):
    sum = 0;
    for i in range(len(arr)):
        sum += arr[i]
    return sum / len(arr)
Here is the Python code for calculating the standard deviation. For calculating the standard deviation of the population (passing dist = ‘population’ in stddev method), the size of the data N is used.
import math
'''
Calculate the biased and unbiased estimation of
standard deviation
'''
def stddev(arr, dist='sample'):
    squaredSum = 0.0
    meanArr = mean(arr)
    for i in range(len(arr)):
        squaredSum += math.pow((arr[i] - meanArr),2)
        i += 1
    sdVal = 0
    if dist == 'sample':
        #
        # For biased estimation, the formula becomes
        # SQRT(((Xi - Xmean)**2)/N)
        #
        sdVal = math.sqrt(squaredSum/(len(arr) - 1))
    elif dist == 'population':
        #
        # For unbiased estimation, the formula becomes
        # SQRT(((Xi - Xmean)**2)/(N-1))
        #
        sdVal = math.sqrt(squaredSum/(len(arr)))
    else:
        return -1
    return sdVal
stddev(arr1), stddev(arr2)
When the standard deviation is calculated by passing arr1 and arr2 to stddev method, the standard deviation values came out to be 6.32, 2.83 respectively. You can note that although the mean value was found to be same, the standard deviation came out to be different representing the nature of the data set.
Standard Deviation Calculator
Here is a calculator for calculating population and sample standard deviation. Provide the comma-separated numbers as input and select a type (Population or sample). The calculator will appropriately calculate population or sample standard deviation based on appropriate formula discussed earlier in this blog.
Different techniques for calculating Standard Deviation
Standard deviation can also be calculated some of the following techniques:
- Using custom python method as shown in the previous section
- Using statistics library method such as stdev and pstdev
- Using numpy library method such as stdev
# Statistics Library Example
using statistics library in the following manner. Note that stdev calculates the standard deviation of the sample while pstdev calculates the standard deviation of the population.
from from statistics import stdev, pstdev
stdev(arr1), stdev(arr2)
# Numpy Library Example
One can also use Numpy library to calculate the standard deviation. The std() method by default calculates the standard deviation of the population. However, if one has to calculate the standard deviation of the sample, one needs to pass the value of ddof (delta degrees of freedom) to 1.
narr1 = np.array(arr1)
narr2 = np.array(arr2)
#
# Calculates the standard deviation taking arr1 and arr2 as population
#
narr1.std(), narr2.std()
#
# Calculates the standard deviation taking arr1 and arr2 as sample
#
narr1.std(ddof=1), narr2.std(ddof=1)
Conclusion
Here is what you learned in this post:
- Standard deviation is about determining or measuring the spread of a given data set (sample or population)
- While calculating standard deviation of a sample of data, Bessel’s correction is applied (usage of N-1 instead of N) for calculating the average of squared difference of data points from its mean.
- You can calculate the standard deviation of population and sample using pstdev() and stdev() methods rspectively of statistics library
- You can calculate the standard deviation using std() method of Numpy library. For calculating standard deviation of sample of data, the value of ddof parameter is passed as 1.
- Use the standard deviation formula for sample when data size is small else use standard deviation formula for population.

Check out my latest book titled as First Principles Thinking: Building winning products using first principles thinking.
- Mathematics Topics for Machine Learning Beginners - July 6, 2025
- Questions to Ask When Thinking Like a Product Leader - July 3, 2025
- Three Approaches to Creating AI Agents: Code Examples - June 27, 2025
I found it very helpful. However the differences are not too understandable for me