Last updated: 16th Dec, 2023
In statistics, the t-test is often used in research when the researcher wants to know if there is a significant difference between the mean of sample and the population, or whether there is a significant difference between the means of two groups (unpaired / independent or paired). There are three types of t-tests: the one sample t-test, two samples or independent samples t-test, and paired samples t-test. In this blog post, we will focus on the one sample t-test and explain with formula and examples. As data scientists, it is important for us to understand the concepts of t-test and how to use it in our data analysis. Check out our one-sample t-test calculator tool for means.
What is One-sample T-test?
One-sample T-test is a statistical hypothesis testing technique in which the mean of a sample is tested against a hypothesized value, e.g., a population mean. The t-test is used to determine whether the difference between the sample mean and the hypothesized value, e.g., the population mean is statistically significant or not. This test is particularly useful when the population standard deviation is unknown and the sample size is small (typically less than 30). The distribution used is T-distribution with certain degrees of freedom.
Steps in Conducting a One-Sample T-Test:
We will understand the steps in conducting one-sample t-test with an example.
Assume that the national average score (population mean) for a high school mathematics exam is known to be 70 out of 100. A school wants to evaluate whether its new teaching approach has significantly changed the performance of its students in mathematics compared to the national average. The school selects a random sample of 20 students (sample size) who have been taught using the new teaching method. The average score of these 30 students is calculated to be 75 (sample mean).
-
State the Hypotheses:
- Null Hypothesis ($H_0$): There is no difference between the sample mean and the population mean. Considering the example, the mean score of the students (sample mean) is equal to the national average (population mean), i.e., .
- Alternative Hypothesis ($): There is a significant difference. The mean score of the students is not equal to the national average, i.e., .
-
Calculate the T-Statistic: Using the formula and the data from the sample.
-
Determine the Critical Value: This value is obtained from the t-distribution table based on the desired significance level (commonly 0.05 for a 95% confidence level) and the degrees of freedom ().
-
Make a Decision: If the calculated t-statistic is greater than the critical value, reject the null hypothesis; otherwise, fail to reject the null hypothesis.
-
Interpret the Results: If the null hypothesis is rejected, it suggests that the teaching method significantly impacts the students’ scores compared to the national average.
One-sample T-test Formula
The following is one-sample t-test formula / equation of t-statistics:
T = (X̄ – μ) / S/√n
Where, X̄ is the sample mean, μ is the hypothesized population mean, S is the standard deviation of the sample and n is the number of sample observations.
When working with T-test, T-distribution is used in place of the normal distribution. The t-distribution is a family of curves that are symmetrical about the mean, and have increasing variability as the degrees of freedom increase. The t-test statistic (T) follows a t-distribution with n – 1 degrees of freedom, where n is the number of observations in the sample.
One-sample T-test Example
In this section, we will learn about how to calculate t-statistics in one-sample t-test.
Suppose a claim is made that the average number of days a person spends on vacation is more than or equal to 5 days (hypothesized population mean) based on a sample of 16 people whose mean came out to be 9 days. As a first step, we will formulate the null and alternate hypothesis.
In hypothesis testing, we start by formulating the null hypothesis () and the alternative hypothesis ( or ). The null hypothesis represents a position of no change, no effect, or no difference—it is the hypothesis that the researcher tries to disprove. The alternative hypothesis represents a new theory or the proposition that there is an effect, a change, or a difference.
Based on the claim that the average number of days a person spends on vacation is more than or equal to 5 days, the hypotheses can be formulated as follows:
For a One-Tailed Test:
-
Null Hypothesis (): The average number of days a person spends on vacation is equal to 5 days. Mathematically, .
-
Alternative Hypothesis (): The average number of days a person spends on vacation is more than 5 days. Mathematically, .
Here, we are specifically looking to see if there is evidence to support the claim that people spend more than 5 days on vacation on average, which is why the alternative hypothesis is set up as greater than 5 days.
For a Two-Tailed Test:
If, however, you wanted to test the hypothesis that the average number of vacation days is not equal to 5 (either less than or more than 5), the hypotheses would be formulated differently:
-
Null Hypothesis (): The average number of days a person spends on vacation is equal to 5 days. Mathematically, .
-
Alternative Hypothesis (): The average number of days a person spends on vacation is not equal to 5 days. Mathematically, .
In this case, the alternative hypothesis is testing for any significant difference, regardless of direction (more or fewer vacation days than 5).
One-tailed or a Two-tailed test? Which one to use? For the data we have, where the sample mean is 9 days, and we are testing against the claim that the average number of vacation days is more than or equal to 5, a one-tailed test is most appropriate.
We will use one-sample t-test to test this hypothesis. A one-tailed test will be performed.
T = (X̄ – μ) / S/√n
Where, X̄ is the sample mean, μ is the hypothesized population mean, S is the standard deviation of the sample and n is the number of observations in the sample.
A sample size of 16 persons is taken. The mean number of days spent on vacation by the persons in sample is found to be 9 days with a sample standard deviation is found to be 3 days.
T = (X̄ – μ) / S/√n
= (9 – 5)/(3/ √16)
= 5.33
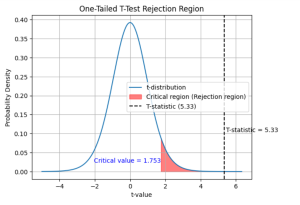
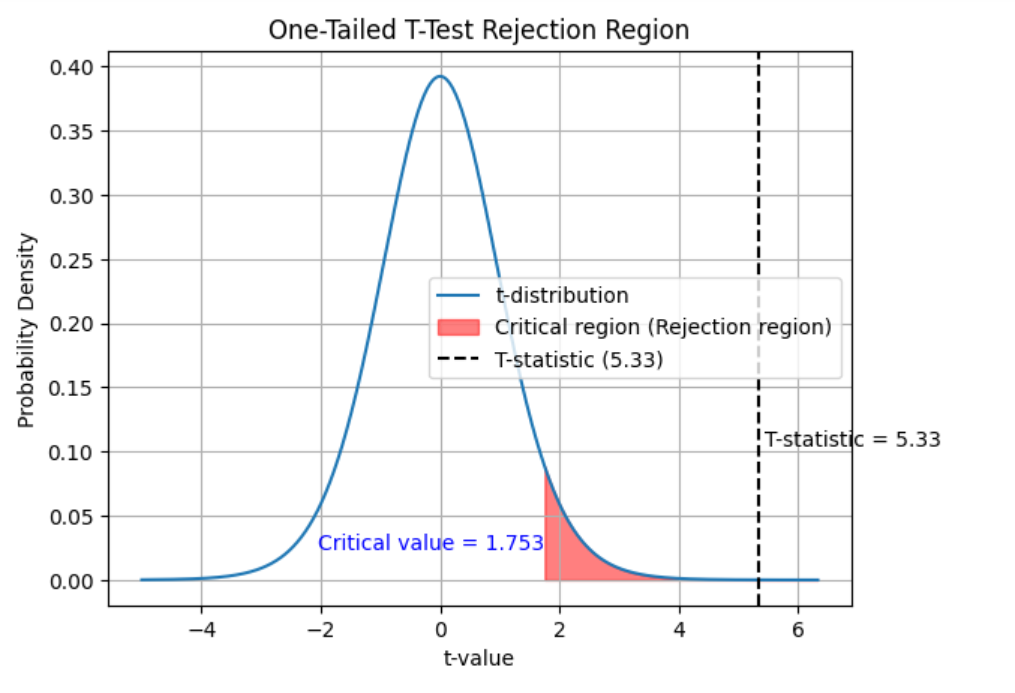
If the calculated t-value is 5.33 and the critical t-value for a one-tailed test at the alpha level of 0.05 is 1.753, you can make the following conclusions about the null hypothesis:
Since the calculated t-value (5.33) is greater than the critical t-value (1.753), you have sufficient evidence to reject the null hypothesis at the 0.05 significance level. This means that there is a statistically significant difference between the sample mean and the hypothesized population mean, and the sample provides enough evidence to support the claim that the average number of days a person spends on vacation is more than 5 days. The following plot can help you visualize the rejection of null hypothesis:
 Another way to test is to get the p-value for getting the T-statistics of 5.33. You can use this One-Sample T-Test calculator to get the T-statistics, degrees of freedom. . For a T-statistics of 5.33 and the types of tail-test (one-tailed or two-tailed test), you can arrive at the p-value of 0.000042. This means that there is a probability of only 0.000042 to get this kind of sample given the null hypothesis holds good. As this value is less than 0.05, one can reject the null hypothesis given the evidence of current sample. Calculate the T-statistics using the following calculator:
Calculating T-Statistics, Critical Value, P-Value using Python
Calculating the t-statistic, critical value, and p-value is central to this test, providing evidence to support or refute hypotheses. Python, with its simplicity and the powerful scipy.stats library, offers a streamlined approach to these calculations. By learning Python code for these purposes, one can efficiently automate the iterative process of hypothesis testing, reduce the potential for manual errors, and focus more on interpreting results rather than getting bogged down in calculations.
The following python code helps you calculate standard error and t-statistics value as 0.75 and 5.33 respectively.
from scipy import stats
import numpy as np
# Given values
sample_mean = 9  # sample mean
population_mean = 5  # hypothesized population mean
sample_size = 16  # number of people
# Assuming standard deviation of the sample is known
std_dev = 1.5  # You'll need to provide this value
# Calculating the standard error
standard_error = sample_std_dev / np.sqrt(sample_size)
# Calculating the t-statistic
t_statistic = (sample_mean - population_mean) / standard_error
# Display results
print(f"Standard Error: {standard_error}")
print(f"T-statistic: {t_statistic}")
# Degrees of freedom
df = 15
# Calculate the p-value for the one-tailed test
p_value = stats.t.sf(t_statistic, df)
print(f"P-value for one-tailed test: {p_value}")
The following gets printed:
Standard Error: 0.75
T-statistic: 5.333333333333333
P-value for one-tailed test: 4.1794868572493856e-05
The following Python code helps calculate critical value:
from scipy import stats
# Degrees of freedom
df = 15  # for a sample size of 16, df = n - 1
# Significance level
alpha = 0.05
# For a one-tailed test, we use the 'ppf' method to find the critical t-value
critical_t_value = stats.t.ppf(1 - alpha, df)
print(f"Critical T-value for one-tailed test at alpha = 0.05: {critical_t_value}")
The critical t-value comes out to be ~1.753. The t-statistics is much larger than this. This is why we can reject the null hypothesis.
Check out our one-sample t-test calculator tool.
T-score / T-statistics for Estimating Population Mean
The population mean can be estimated as a function of the t-score using the following equation:
Population mean = Sample mean + T*(Standard error of the mean)
Where T is a statistic that has a T-distribution with known properties. The standard error of the mean (SE) is an estimate of the standard deviation of the sampling distribution of the t-statistic. The T-statistic can be used to calculate confidence intervals for population means given the sample size is small and the population standard deviation is unknown. When the population standard deviation is know, we use Z-statistics and Z-distribution instead of T-statistics.
The value of standard error of the mean can be calculated as :
SE of the mean = S/√n
Where, S is the standard deviation of the sample and n is the number of observations in the sample.
Summary
The one-sample t-test is a statistical test that can be used to determine whether there is a significant difference between the sample mean and the population mean. The t-test statistic (T) follows a t-distribution with n – 1 degrees of freedom, where n is the number of observations in the sample. T-statistics can be used to estimate the population mean when the population standard deviation is unknown. The t-test can be used to calculate confidence intervals for population means when the sample size is small and the population standard deviation is unknown.

Check out my latest book titled as First Principles Thinking: Building winning products using first principles thinking.
- Agentic Reasoning Design Patterns in AI: Examples - October 18, 2024
- LLMs for Adaptive Learning & Personalized Education - October 8, 2024
- Sparse Mixture of Experts (MoE) Models: Examples - October 6, 2024
Question: In the One-sample T-test example wouldn’t the hypotheses as stated denote a two-tailed test? Therefore the critical value would be 2.131
Null hypothesis, H0: There is no difference between the sample mean and the population mean. Thus H0 x-bar = u
Alternate hypothesis, Ha: There is a significant difference between the sample mean and the population mean. Thus H0 x-bar u
If the alternate hypothesis, Ha was stated differently such as: There is a significant positive difference between the sample mean and the population mean. Thus H0 x-bar > u; denoting a right hand one-tailed test then the critical value would be 1.75. [1] I will note that in either case the 5.33 value does exceed the critical values both the one-tailed and two-tailed.
Thanks, Dave
Source: [1] https://www.nipissingu.ca/sites/default/files/One-tailed-Test-or-Two-tailed-Test.pdf
Hi Dave,
You are correct in pointing out that the hypotheses mentioned in the example denote a two-tailed test, which tests for the possibility of the sample mean being significantly greater or less than the hypothesized population mean.
For a two-tailed test with α = 0.05 and 15 degrees of freedom (n-1), the critical t-value is approximately 2.131. This value will reject the null hypothesis if the calculated t-statistic is either less than -2.131 or greater than 2.131. Since 5.33 is greater than 2.131, we can reject the null hypothesis.
Made the appropriate changes.
Thank you
Hello. May I ask, the problem states that that the average number of days on vacation is more than or equal to 16, so shouldn’t that mean that µ≥5 is the null hypothesis while the alternative hypothesis is µ<5?
Please answer speedily. God bless and thanks!
As the claim is made about average number of days spent on vacation is greater than or equal to 5 days, we are talking about establishing a new truth such as µ≥5. The null hypothesis would rather be µ<5. Read my post on hypothesis testing for more details (https://vitalflux.com/data-science-how-to-formulate-hypothesis-for-hypothesis-testing/)
[…] test is a non-parametric test which is often seen as a cousin to the one-sample t-test, allows us to infer information about a whole population based on a small, paired sample. It is […]