Tag Archives: statistics
Chi-square test – Formula, Concepts, Examples
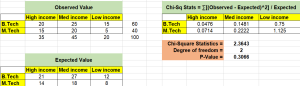
The Pearson’s Chi-square (χ2) test is a statistical test used to determine whether the distribution of observed data is consistent with the distribution of data expected under a particular hypothesis. The Chi-square test can be used to compare or evaluate the independence of two distributions, or to assess the goodness of fit of a given distribution to observed data. In this blog post, we will discuss different types of Chi-square tests, the concepts behind them, and how to perform them using Python / R. As data scientists, it is important to have a strong understanding of the Chi-square test so that we can use it to make informed decisions about …
Sign Test Hypothesis: Python Examples, Concepts
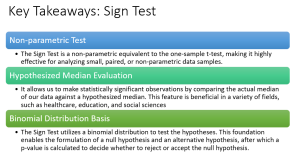
Have you ever wanted to make an informed decision, but all you have is a small amount of non-parametric data? In the realm of statistics, we have various tools that enable us to extract valuable insights from such datasets. One of these handy tools is the Sign test, a beautifully simple yet potent method for hypothesis testing. Sign test is a non-parametric test which is often seen as a cousin to the one-sample t-test, allows us to infer information about a whole population based on a small, paired sample. It is particularly useful when dealing with dichotomous data – Data that can have only two possible outcomes. In this blog …
Mann-Whitney U Test (Wilcoxon Rank Sum): Python Example
In the ever-evolving world of data science, extracting meaningful insights from diverse data sets is a fundamental task. However, a significant problem arises when these data sets do not conform to the assumptions of normality and equal variances, rendering popular parametric tests like the t-test ineffectual. Real-world data often tends to be skewed, includes outliers, or originates from an unknown distribution. For instance, data related to salaries, house prices, or user behavior metrics often challenge traditional statistical methods. This is where the Wilcoxon Rank Sum Test, also known as the Mann-Whitney U test, proves to be an invaluable statistical test. As a non-parametric alternative to the independent two-sample t-test, it …
Types of Data Visualization: Charts, Plots Examples
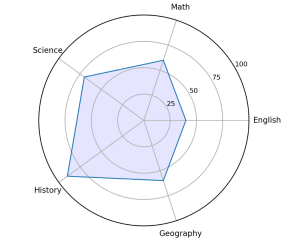
In today’s data-driven world, the ability to extract insights from vast amounts of information has become a critical skill for data scientists and analysts. Visualizing data through charts, graphs, and other types of visual representations can help them uncover patterns and relationships that might be difficult to spot otherwise. However, not all visualizations are created equal, and choosing the right type of visualization can make all the difference in communicating insights effectively. That’s why understanding the different types of visualization available is crucial for data visualization experts and data scientists. In this blog, we’ll explore some of the most common types of visualization, including comparison plots, relation plots, composition plots …
Kruskal Wallis H Test Formula, Python Example
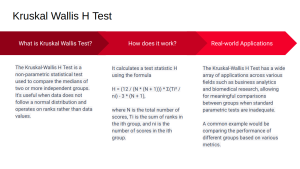
Ever wondered how to find out if different groups of people have different preferences? Maybe you’re a marketer trying to understand if different age groups prefer different features in a smartphone. Or perhaps you’re a public policy researcher, trying to determine if different neighborhoods are equally satisfied with their local services. How do you go about answering these questions, especially when the data doesn’t follow the typical bell-shaped curve or normal distribution? The solution lies in the Kruskal-Wallis H Test! This is a non-parametric test that helps to compare more than two independent groups and it comes in really handy when the data is not bell-shaped curve data or not …
Clinical Trials & Statistics Use Cases: Examples

Are you a statistician, data scientist or business analyst working in the field of clinical trials? Do you find yourself curious about how statistical analyses play a pivotal role in unlocking valuable actionable insights and driving critical decisions in drug development? If so, in this blog, we will learn about various different use cases where clinical trials and statistics intersect. Clinical trials are the backbone of evidence-based medicine, paving the way for the discovery and development of innovative therapies that can improve patient outcomes. Within this realm, statistics allows researchers and analysts to make sense of complex data, evaluate treatment efficacy, assess safety profiles, and optimize trial design. In this …
Spearman Correlation Coefficient: Formula, Examples
Have you ever wondered how you might determine the relationship between two sets of data that aren’t necessarily linear, or perhaps don’t adhere to the assumptions of other correlation measures? Enter the Spearman Rank Correlation Coefficient, a non-parametric statistic that offers robust insights into the monotonic relationship between two variables – perfect for dealing with ranked variables or exploring potential relationships in a new, exploratory dataset. In this blog post, we will learn the concepts of Spearman correlation coefficient with the help of Python code examples. Understanding the concept can prove to be very helpful for data scientists. Whether you’re exploring associations in marketing data, results from a customer satisfaction …
Binomial Distribution Explained with Examples
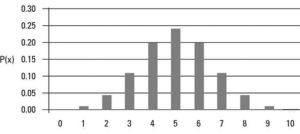
Have you ever wondered how to predict the number of successes in a series of independent trials? Or perhaps you’ve been curious about the probability of achieving a specific outcome in a sequence of yes-or-no questions. If so, we are essentially talking about the binomial distribution. It’s important for data scientists to understand this concept as binomials are used often in business applications. The binomial distribution is a discrete probability distribution that applies to binomial experiments (experiments with binary outcomes). It’s the number of successes in a specific number of trials. Sighting a simple yet real-life example, the binomial distribution may be imagined as the probability distribution of a number …
One-way ANOVA test: Concepts, Formula & Examples
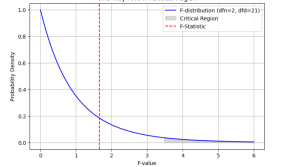
The one-way analysis of variance (ANOVA) test is a statistical procedure commonly used to compare the means values on a specific variable between three or more groups. The significance of the difference between the means of two samples can be judged through either t-test or z-test depending upon different criteria, but it becomes tricky when there is a need to simultaneously evaluate the significance of the difference amongst three or more sample means. This is where one-way ANOVA test comes to rescue. The ANOVA technique enables us to perform this simultaneous test and as such is considered to be an important tool of analysis. As data scientists, it is of …
Neyman-Pearson Lemma: Hypothesis Test, Examples
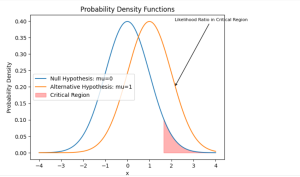
Have you ever faced a crucial decision where you needed to rely on data to guide your choice? Whether it’s determining the effectiveness of a new medical treatment or assessing the quality of a manufacturing process, hypothesis testing becomes essential. That’s where the Neyman-Pearson Lemma steps in, offering a powerful framework for making informed decisions based on statistical evidence. The Neyman-Pearson Lemma holds immense importance when it comes to solving problems that demand decision making or conclusions to a higher accuracy. By understanding this concept, we learn to navigate the complexities of hypothesis testing, ensuring we make the best choices with greater confidence. In this blog post, we will explore …
Z-score or Z-statistics: Concepts, Formula & Examples
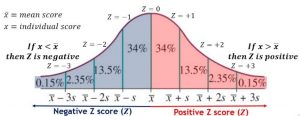
Z-score, also known as the standard score or Z-statistics, is a powerful statistical concept that plays a vital role in the world of data science. It provides a standardized method for comparing data points from different distributions, allowing data scientists to better understand and interpret the relative positioning of individual data points within a dataset. Z-scores represent a statistical technique of measuring the deviation of data from the mean. It is also used with Z-test which is a hypothesis testing statistical technique (one sample Z-test or two samples Z-test). As a data scientist, it is of utmost importance to be well-versed with the z-score formula and its various applications. Having …
Descriptive Statistics – Key Concepts & Examples
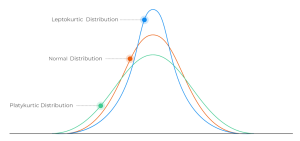
Descriptive statistics is a branch of statistics that deals with the analysis of data. It is concerned with summarizing and describing the characteristics of a dataset. It is one of the most fundamental tool for data scientists to understand the data as they get started working on the dataset. In this blog post, I will cover the key concepts of descriptive statistics, including measures of central tendency, measures of spread and statistical moments. What’s Descriptive Statistics & Why do we need it? Descriptive statistics is used to summarize and describe the characteristics of a dataset in terms of understanding its mean & related measures, spread or dispersion of the data …
Quiz #85: MSE vs R-Squared?

Regression models are an essential tool for data scientists and statisticians to understand the relationship between variables and make predictions about future outcomes. However, evaluating the performance of these models is a crucial step in ensuring their accuracy and reliability. Two commonly used metrics for evaluating regression models are Mean Squared Error (MSE) and R-squared. Understanding when to use each metric and how they differ can greatly improve the quality of your analyses. Check out my related blog on this topic – Mean Squared Error vs R-Squared? Which one to use? To help you test your knowledge on MSE and R-squared (also known as coefficient of determination), we have created …
Degree of Freedom in Statistics: Meaning & Examples
The degree of freedom (DOF) is a term that statisticians use to describe the degree of independence in statistical data. A degree of freedom can be thought of as the number of variables that are free to vary, given one or more constraints. When you have one degree, there is one variable that can be freely changed without affecting the value for any other variable. As a data scientist, it is important to understand the concept of degree of freedom, as it can help you do accurate statistical analysis and validate the results. In this blog, we will explore the meaning of degree of freedom in statistics, its importance in …
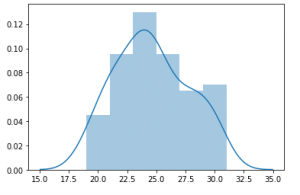
Positively Skewed Probability Distributions: Examples
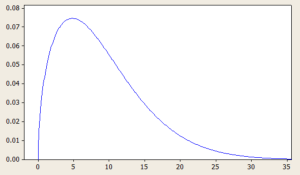
Probability distributions are an essential concept in statistics and data analysis. They describe the likelihood of different outcomes or events occurring and provide valuable insights into the characteristics of a given data set. Skewness is an important aspect of probability distributions that can have a significant impact on data analysis and decision-making. In this blog, we will focus on positively skewed probability distributions and explore some real-life examples where these distributions occur. We will discuss what a positively skewed distribution is, what are its different types with formula and definitions. By the end of this blog, you will have a better understanding of positively skewed distributions and be able to …
Statistics Terminologies Cheat Sheet & Examples
Have you ever felt overwhelmed by all the statistics terminology out there? From sampling distribution to central limit theorem to null hypothesis to p-values to standard deviation, it can be hard to keep up with all the statistical concepts and how they fit into your research. That’s why we created a Statistics Terminologies Cheat Sheet & Examples – a comprehensive guide to help you better understand the essential terms and their use in data analysis. Our cheat sheet covers topics like descriptive statistics, probability, hypothesis testing, and more. And each definition is accompanied by an example to help illuminate the concept even further. Understanding statistics terminology is critical for data …
I found it very helpful. However the differences are not too understandable for me