Tag Archives: python
Free IBM Data Sciences Courses on Coursera

In the rapidly evolving fields of Data Science and Artificial Intelligence, staying ahead means continually learning and adapting. In this blog, there is a list of around 20 free data science-related courses from IBM available on coursera.org that can help data science enthusiasts master different domains in AI / Data Science / Machine Learning. This list includes courses related to the core technical skills and knowledge needed to excel in these innovative fields. Foundational Knowledge: Understanding the essence of Data Science lays the groundwork for a successful career in this field. A solid foundation helps you grasp complex concepts easily and contributes to better decision-making, problem-solving, and the capacity to …
NLP Tokenization in Machine Learning: Python Examples

Last updated: 1st Feb, 2024 Tokenization is a fundamental step in Natural Language Processing (NLP) where text is broken down into smaller units called tokens. These tokens can be words, characters, or subwords, and this process is crucial for preparing text data for further analysis like parsing or text generation. Tokenization plays a crucial role in training machine learning models, particularly Large Language Models (LLMs) like GPT (Generative Pre-trained Transformer) series, BERT (Bidirectional Encoder Representations from Transformers), and others. Tokenization is often the first step in preparing text data for machine learning. LLMs use tokenization as an essential data preprocessing step. Advanced tokenization techniques (like those used in BERT) allow …
LLM Optimization for Inference – Techniques, Examples
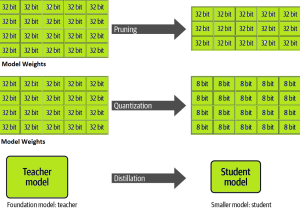
One of the common challenges faced with the deployment of large language models (LLMs) while achieving low-latency completions (inferences) is the size of the LLMs. The size of LLM throws challenges in terms of compute, storage, and memory requirements. And, the solution to this is to optimize the LLM deployment by taking advantage of model compression techniques that aim to reduce the size of the model. In this blog, we will look into three different optimization techniques namely pruning, quantization, and distillation along with their examples. These techniques help model load quickly while enabling reduced latency during LLM inference. They reduce the resource requirements for the compute, storage, and memory. …
Generalization Errors in Machine Learning: Python Examples
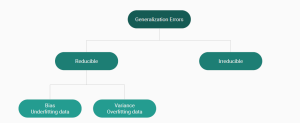
Last updated: 21st Jan, 2024 Machine Learning (ML) models are designed to make predictions or decisions based on data. However, a common challenge, data scientists face when developing these models is ensuring that they generalize well to new, unseen data. Generalization refers to a model’s ability to perform accurately on new, unseen examples after being trained on a limited set of data. When models don’t generalize well, they commit errors. These errors are called generalization errors. In this blog, you will learn about different types of generalization errors, with examples, and walk through a simple Python demonstration to illustrate these concepts. Types of Generalization Errors Generalization errors in machine learning …
NLP: Different Types of Language Models – Examples

Have you ever wondered how your smartphone seems to know exactly what you’re going to type next? Or how virtual assistants like Alexa and Siri understand and respond to your queries with such precision? The magic is NLP language models. In this blog, we will explore the diverse types of language models in NLP that have evolved over time, each with its unique capabilities and applications. From the simplicity of N-gram models, which predict text based on preceding words, to the sophisticated neural network-based models like RNNs, LSTMs, and the groundbreaking large language models using Transformers, we will learn about the intricacies of these models, examples of real-world applications and …
Bag of Words in NLP & Machine Learning: Examples
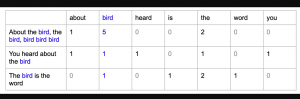
Last updated: 6th Jan, 2024 Most machine learning algorithms require numerical input for training the models. Bag of words (BoW) effectively converts text data into numerical feature vectors, making it compatible with a wide range of machine learning algorithms, from linear classifiers like logistic regression to complex ones like neural networks. In this post, you will learn about the concepts of bag-of-words model and how to train a text classification model using Python Sklearn. Some of the most common text classification problems includes sentiment analysis, spam filtering etc. In these problems, one can apply bag-of-words technique to train machine learning models for text classification. It will be good to understand the …
Cohen Kappa Score Explained: Formula, Example
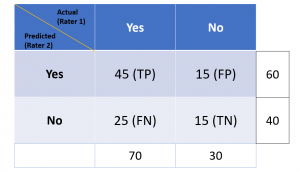
Last updated: 5th Jan, 2024 Cohen’s Kappa Score is a statistic used to measure the performance of machine learning classification models. In this blog post, we will discuss what Cohen’s Kappa Score is and Python code example representing how to calculate Kappa score using Python. We will also provide a code example so that you can see how it works! What is Cohen’s Kappa Score or Coefficient? Cohen’s Kappa Score, also known as the Kappa Coefficient, is a statistical measure of inter-rater agreement for categorical data. Cohen’s Kappa Coefficient is named after statistician Jacob Cohen, who developed the metric in 1960. It is generally used in situations where there …
Machine Learning Models Solution Design: Examples

This blog is crafted for data scientists, machine learning (ML) and software engineers, business analysts / product managers, and anyone involved in the ML project lifecycle, aiming to create a reliable solution design and development strategy / plan for successful AI / machine learning project implementation and value realization. The blog revolves around a series of critical solution design questions, meticulously curated to guide teams from the initial conception of a project to its final deployment and beyond. By addressing each of these solution design questions, teams can ensure that they are not only building a model that is technically proficient but also one that aligns seamlessly with business objectives, …
Micro-average, Macro-average, Weighting: Precision, Recall, F1-Score
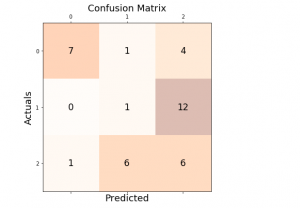
Last updated: 30th Dec, 2023 In this post, you will learn about how to use micro-averaging and macro-averaging methods for evaluating scoring metrics (precision, recall, f1-score) for multi-class classification machine learning problem. You will also learn about weighting method used as one of the other averaging choices of metrics such as precision, recall and f1-score for multi-class classification problem. The concepts will be explained with Python code examples. What & Why of Micro, Macro-averaging and Weighting metrics? Micro and macro-averaging methods are used in the evaluation of classification models, to compute performance metrics like precision, recall, and F1-score. These methods are especially relevant in scenarios involving multi-class or multi-label classification. In case of multi-class classification, …
Mean Squared Error or R-Squared – Which one to use?
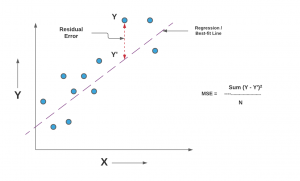
Last updated: 29th Dec, 2023 As you embark on your journey to understand and evaluate the performance of regression models, it’s crucial to know when to use each of these metrics and what they reveal about your model’s accuracy. In this post, you will learn about the concepts of the mean-squared error (MSE) and R-squared (R2), the difference between them, and which one to use when evaluating the linear regression models. Note that MSE is very closely related to root mean squared error (RMSE) which is also discussed in this blog. You also learn Python examples to understand the concepts in a better manner. For learning the differences between other …
Introducing Our New Data Science & AI Trends Page

We are thrilled to announce the launch of our dedicated Data Science and AI Trends page at VitalFlux.com! This new resource is designed to be a one-stop hub for data scientists, AI enthusiasts, and anyone passionate about staying at the forefront of technological innovation. What You’ll Find Our Data Science & AI Trends page is more than just a collection of articles; it’s a dynamic resource that aggregates the most insightful and current information from various high-impact sources. Here’s a sneak peek at what you can expect: Web Pages Stay informed with our selection of web pages from leading research institutions, tech news outlets, and individual thought leaders in the …
Z-test vs T-test: Formula, Examples
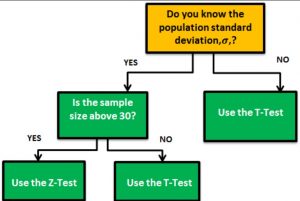
Last updated: 18th Dec, 2023 When it comes to statistical tests, z-test and t-test are two of the most commonly used. But what is the difference between z-test and t-test? And when to use z-test vs t-test? In this relation, we also wonder about z-statistics vs t-statistics. And, the question arises around what’s the difference between z-statistics and t-statistics. In this blog post, we will answer all these questions and more! We will start by explaining the difference between z-test and t-test in terms of their formulas. Then we will go over some examples so that you can see how each test is used in practice. As data scientists, it …
Python – Replace Missing Values with Mean, Median & Mode
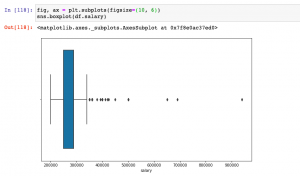
Last updated: 18th Dec, 2023 Have you found yourself asking question such as how to deal with missing values in data analysis stage? When working with Python, have you been troubled with question such as how to replace missing values in Pandas data frame? Well, missing values are common in dealing with real-world problems when the data is aggregated over long time stretches from disparate sources, and reliable machine learning modeling demands for careful handling of missing data. One strategy is imputing the missing values, and a wide variety of algorithms exist spanning simple interpolation (mean, median, mode), matrix factorization methods like SVD, statistical models like Kalman filters, and deep …
Standard Deviation of Population vs Sample
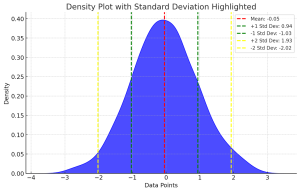
Last updated: 18th Dec, 2023 Have you ever wondered what the difference between standard deviation of population and a sample? Or why and when it’s important to measure the standard deviation of both? In this blog post, we will explore what standard deviation is, the differences between the standard deviation of population and samples, and how to calculate their values using their formula and Python code example. By the end of this post, you should have a better understanding of standard deviation in general and why it’s important to calculate it for both populations and samples. Check out my related post – coefficient of variation vs standard deviation. What is …
Linear Regression vs. Polynomial Regression: Python Examples
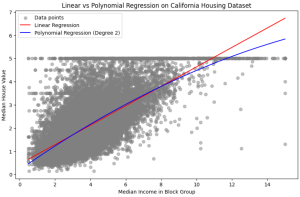
In the realm of predictive modeling and data science, regression analysis stands as a cornerstone technique. It’s essential for understanding relationships in data, forecasting trends, and making informed decisions. This guide delves into the nuances of Linear Regression and Polynomial Regression, two fundamental approaches, highlighting their practical applications with Python examples. What are Linear and Polynomial Regression? In this section, we will learn about what are linear and polynomial regression. What is Linear Regression? Linear Regression is a statistical method used in predictive analysis. It’s a straightforward approach for modeling the relationship between a dependent variable (often denoted as y) and one or more independent variables (denoted as x). In …
Random Forest vs XGBoost: Which One to Use? Examples

Understanding the differences between XGBoost and Random Forest machine learning algorithm is crucial as it guides the selection of the most appropriate model for a given problem. Random Forest, with its simplicity and parallel computation, is ideal for quick model development and when dealing with large datasets, whereas XGBoost, with its sequential tree building and regularization, excels in achieving higher accuracy, especially in scenarios where overfitting is a concern. This knowledge can be helpful to balance between computational efficiency and predictive performance, tailor models to specific data characteristics, and optimize their approach for either rapid prototyping or precision-focused tasks. In this blog, we will learn the difference between Random Forest …
I found it very helpful. However the differences are not too understandable for me