Tag Archives: python
Huggingface Arxiv Dataset: Python Example

Working with large and specific datasets is a common requirement in the field of natural language processing (NLP) and machine learning. The Arxiv dataset, containing metadata such as titles, abstracts, years, and categories of research papers, is an invaluable resource for researchers and data scientists. How can we easily load this dataset and extract the required information? In this blog post, we will explore a Python example using the Hugging Face library to load the Arxiv dataset and extract specific metadata. Python Code for Loading Huggingface Arxiv Dataset The following are the steps to load Hugging face Arxiv dataset using python code: Real-World Application Use Cases: Analyzing Research Papers Imagine …
Autoregressive (AR) Models Python Examples: Time-series Forecasting

Autoregressive (AR) models, which are used for text generation tasks and time series forecasting, can be employed to predict future values predicated on previous observations. This blog post will provide the concepts of autoregressive (AR) models with Python code examples to demonstrate how you can implement an AR model for time-series forecasting. Note that time-series forecasting is one of the important areas of data science/machine learning. In subsequent blogs, we will take up the topic of how autoregressive models can be used as generative model for text generation tasks. For beginners, time-series forecasting is the process of using a model to predict future values based on previously observed values. Time-series data …
Sign Test Hypothesis: Python Examples, Concepts
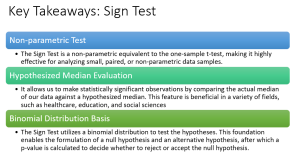
Have you ever wanted to make an informed decision, but all you have is a small amount of non-parametric data? In the realm of statistics, we have various tools that enable us to extract valuable insights from such datasets. One of these handy tools is the Sign test, a beautifully simple yet potent method for hypothesis testing. Sign test is a non-parametric test which is often seen as a cousin to the one-sample t-test, allows us to infer information about a whole population based on a small, paired sample. It is particularly useful when dealing with dichotomous data – Data that can have only two possible outcomes. In this blog …
K-Means Clustering Concepts & Python Example
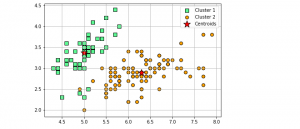
Clustering is a popular unsupervised machine learning technique used in data analysis to group similar data points together. The K-Means clustering algorithm is one of the most commonly used clustering algorithms due to its simplicity, efficiency, and effectiveness on a wide range of datasets. In K-Means clustering, the goal is to divide a given dataset into K clusters, where each data point belongs to the cluster with the nearest mean value. The algorithm works by iteratively updating the cluster centroids until convergence is achieved. In this post, you will learn about K-Means clustering concepts with the help of fitting a K-Means model using Python Sklearn KMeans clustering implementation. You will …
Kruskal Wallis H Test Formula, Python Example
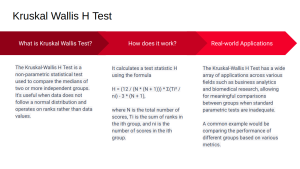
Ever wondered how to find out if different groups of people have different preferences? Maybe you’re a marketer trying to understand if different age groups prefer different features in a smartphone. Or perhaps you’re a public policy researcher, trying to determine if different neighborhoods are equally satisfied with their local services. How do you go about answering these questions, especially when the data doesn’t follow the typical bell-shaped curve or normal distribution? The solution lies in the Kruskal-Wallis H Test! This is a non-parametric test that helps to compare more than two independent groups and it comes in really handy when the data is not bell-shaped curve data or not …
Weighted Regression Model Python Examples
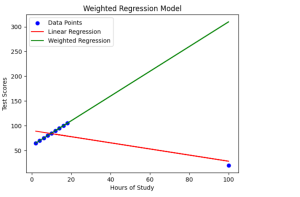
Have you ever wondered how regression models can be enhanced to provide more accurate predictions, even in the presence of outliers or data points with varying significance? Enter weighted regression machine learning models, an approach that assigns weights to data points, allowing for precise adjustments and improvements in prediction accuracy. In this blog post, we will learn about the concepts of weighted regression models with the help of examples while demonstrating with the help of Python implementation. Traditional linear regression is a widely-used technique, but it may struggle when faced with outliers or situations where some data points carry more weight than others. However, weighted regression models help overcome these …
Spearman Correlation Coefficient: Formula, Examples
Have you ever wondered how you might determine the relationship between two sets of data that aren’t necessarily linear, or perhaps don’t adhere to the assumptions of other correlation measures? Enter the Spearman Rank Correlation Coefficient, a non-parametric statistic that offers robust insights into the monotonic relationship between two variables – perfect for dealing with ranked variables or exploring potential relationships in a new, exploratory dataset. In this blog post, we will learn the concepts of Spearman correlation coefficient with the help of Python code examples. Understanding the concept can prove to be very helpful for data scientists. Whether you’re exploring associations in marketing data, results from a customer satisfaction …
Heteroskedasticity in Regression Models: Examples
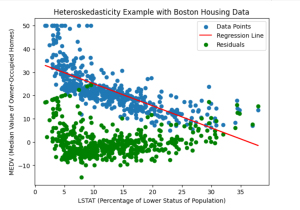
Have you ever encountered data that exhibits varying patterns of dispersion and wondered how it might impact your regression models? The varying patterns of dispersion represents the essence of heteroskedasticity – the phenomenon where the spread or variability of the residuals / errors in a regression model changes across different levels or values of the independent variables. As data scientists, understanding the concept of heteroskedasticity is crucial for robust and accurate analyses. In this blog, we delve into the intriguing world of heteroskedasticity in regression models and explore its implications through real-world examples. What’s heteroskedasticity and why learn this concept? Heteroskedasticity refers to a statistical phenomenon observed in regression analysis, …
Matplotlib Bar Chart Python / Pandas Examples
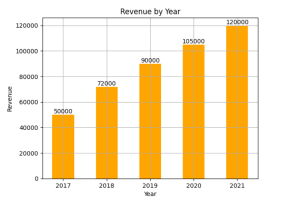
Are you looking to learn how to create bar charts / bar plots / bar graph using the combination of Matplotlib and Pandas in Python? Bar charts are one of the most commonly used visualizations in data analysis, enabling us to present categorical data in a visually appealing and intuitive manner. Whether you’re a beginner data scientist or an intermediate-level practitioner seeking to enhance your visualization skills, this blog will provide you with practical examples and hands-on guidance to create compelling bar charts / bar plots using Matplotlib libraries in Python. You will also learn how to leverage the data manipulation capabilities of Pandas to prepare the data for visualization, …
One-hot Encoding Concepts & Python Examples
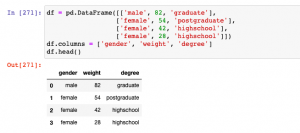
Have you ever encountered categorical variables in your data analysis or machine learning projects? These variables represent discrete qualities or characteristics, such as colors, genders, or types of products. While numerical variables can be directly used as inputs for machine learning algorithms, categorical variables require a different approach. One common technique used to convert categorical variables into a numerical representation is called one-hot encoding, also known as dummy encoding. When working with machine learning algorithms, categorical variables need to be transformed into a numerical representation to be effectively used as inputs. This is where one-hot encoding comes to rescue. In this post, you will learn about One-hot Encoding concepts and …
What & When: List, Tuple & Set in Python – Examples
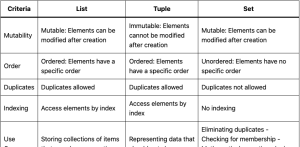
When working with Python programming, data structures play a crucial role in organizing and manipulating data efficiently. Among several data structures available, lists, tuples, and sets are three fundamental ones that every Python programmer/developer should understand. Lists, tuples, and sets are unique in terms of their properties and functionality, making them most appropriate for different scenarios. Not only are these data structures most frequently used in everyday programming tasks, but they are also frequently asked about in interviews with data analysts and data scientists. Therefore, grasping the concepts of lists, tuples, and sets becomes essential. In this blog, we will delve deeper into the specifics of lists, tuples, and sets, …
Ridge Regression Concepts & Python example
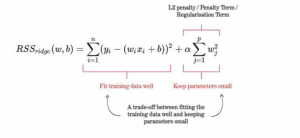
Ridge regression is a type of linear regression that penalizes ridge coefficients. This technique can be used to reduce the effects of multicollinearity in ridge regression, which may result from high correlations among predictors or between predictors and independent variables. In this tutorial, we will explain ridge regression with a Python example. What is Ridge Regression? Ridge regression is a powerful technique in machine learning that addresses the issue of overfitting in linear models. In linear regression, we aim to model the relationship between a response variable and one or more predictor variables. However, when there are multiple variables that are highly correlated, the model can become too complex and …
Neyman-Pearson Lemma: Hypothesis Test, Examples
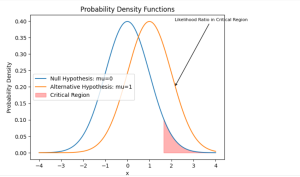
Have you ever faced a crucial decision where you needed to rely on data to guide your choice? Whether it’s determining the effectiveness of a new medical treatment or assessing the quality of a manufacturing process, hypothesis testing becomes essential. That’s where the Neyman-Pearson Lemma steps in, offering a powerful framework for making informed decisions based on statistical evidence. The Neyman-Pearson Lemma holds immense importance when it comes to solving problems that demand decision making or conclusions to a higher accuracy. By understanding this concept, we learn to navigate the complexities of hypothesis testing, ensuring we make the best choices with greater confidence. In this blog post, we will explore …
Pandas CSV to Dataframe Python Example
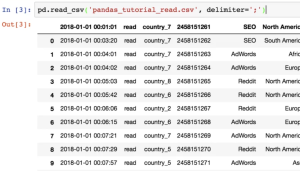
Converting CSV files to DataFrames is a common task in data analysis. In this blog, we’ll explore a Python code example using the Pandas library to efficiently convert CSV files to DataFrames. This approach offers flexibility, speed, and convenience, making it a valuable technique for handling large datasets. Read CSV into Pandas Dataframe The following is the code which can be used to read the CSV file from local drive: In case, you want to read CSV file from the URL, the following will be the code. As a matter of fact, nothing changes except for the fact that you pass the URL to read_csv function. The following are some …
Outlier Detection Techniques in Python: Examples
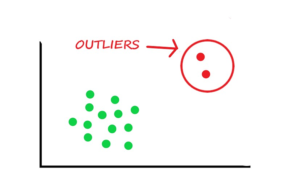
In the realm of data science, mastering outlier detection techniques is paramount for ensuring data integrity and robust machine learning model performance. Outliers are the data points which deviate significantly from the norm. The outliers data points can greatly impact the accuracy and reliability of statistical analyses and machine learning models. In this blog, we will explore a variety of outlier detection techniques using Python. The methods covered will include statistical approaches like the z-score method and the interquartile range (IQR) method, as well as visualization techniques like box plots and scatter plots. Whether you are a data science enthusiast or a seasoned professional, it is important to grasp these …
Python Tesseract PDF & OCR Example
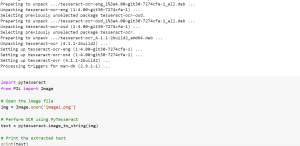
Have you ever needed to extract text from an image or a PDF file? If so, you’re in luck! Python has an amazing library called Tesseract that can perform Optical Character Recognition (OCR) to extract text from images and PDFs. In this blog, I will share sample Python code using with you can use Tesseract to extract text from images and PDFs. As a data scientist, it can be very helpful and useful to be able to extract text from images or PDFs, especially when working with large amounts of data found in receipts, invoices, etc. Tesseract is an OCR engine widely used in the industry, known for its accuracy …
I found it very helpful. However the differences are not too understandable for me