Last updated: 29th Dec, 2023
As you embark on your journey to understand and evaluate the performance of regression models, it’s crucial to know when to use each of these metrics and what they reveal about your model’s accuracy. In this post, you will learn about the concepts of the mean-squared error (MSE) and R-squared (R2), the difference between them, and which one to use when evaluating the linear regression models. Note that MSE is very closely related to root mean squared error (RMSE) which is also discussed in this blog. You also learn Python examples to understand the concepts in a better manner. For learning the differences between other evaluation metrics such as mean absolute error (MAE), mean absolute percentage error (MAPE), check out this blog post: MSE vs RMSE vs MAE vs MAPE vs R-Squared (R2)
What is Mean Squared Error (MSE)?
The Mean squared error (MSE) represents the error of the estimator or predictive model created based on the given set of observations in the sample. It measures the average squared difference between the predicted values and the actual values, quantifying the discrepancy between the model’s predictions and the true observations. Intuitively, the MSE is used to measure the quality of the model based on the predictions made on the entire training dataset vis-a-vis the true label/output value. In other words, it can be used to represent the cost associated with the predictions or the loss incurred in the predictions. In 1805, the French mathematician Adrien-Marie Legendre, who first published the sum of squares method for gauging the quality of the model stated that squaring the error before summing all of the errors to find the total loss is convenient.
Two or more regression models created using a given sample of data can be compared based on their MSE. The lower the MSE, the better the model predictive accuracy, and, the better the regression model is. The Python or R packages can be used to select the best-fit model as the model with the lowest MSE or lowest RMSE statistics when training the linear regression models.
What’s RMSE and how is it related to MSE?
The related concept used for evaluating the quality of model is root mean squared error (RMSE). Both MSE and RMSE measures are used to evaluate the performance of a model, especially in the context of regression analysis. Here’s how they are related:
- Definition:
- Mean Squared Error (MSE) is the average of the squares of the errors or deviations. The error is the amount by which the actual values differ from the predicted values.
- Root Mean Squared Error (RMSE) is the square root of MSE.
- Sensitivity to Outliers: Both MSE and RMSE are sensitive to outliers because they square the errors. The effect of outliers is more pronounced due to this squaring.
- Use in Model Evaluation:
- Both metrics are used to measure the quality of a predictor or a regression model; lower values indicate a better fit.
- RMSE is more commonly reported as it is more interpretable, being in the same units as the dependent variable.
Here are some of the Kaggle competitions which used RMSE as the evaluation metrics:
- Google Analytics Customer Revenue Prediction
- Elo Merchant Category Recommendation
- Avito Demand Prediction Challenge
Why use mean squared error (MSE) loss function?
Here are some of the reasons why MSE can be used as the loss function:
- Ease of interpretation: MSE provides a single, aggregated value that quantifies a model’s overall prediction error, making it easy to compare the performance of different models.
- Squared terms emphasizes larger errors: By squaring the differences between predicted and observed values, MSE emphasizes larger errors, penalizing models that make significant mistakes more heavily.
- Differentiability: MSE is a continuous and differentiable function, which makes it well-suited for optimization techniques such as gradient descent. The question that may be asked is why not calculate the error as the absolute value of loss (difference between y and y_hat in the following formula) and sum up all the errors to find the total loss. The absolute value of error is not convenient, because it doesn’t have a continuous derivative, which does not make the function smooth. And, the functions that are not smooth are difficult to work with when trying to find closed-form solutions to the optimization problems by employing linear algebra concepts.
Despite its advantages, MSE has some limitations, such as its sensitivity to outliers and the absence of an upper bound on its values. However, it remains a popular choice for evaluating regression models due to its simplicity, interpretability, and suitability for optimization.
Formula: How to calculate MSE?
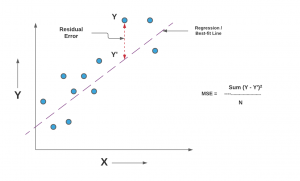
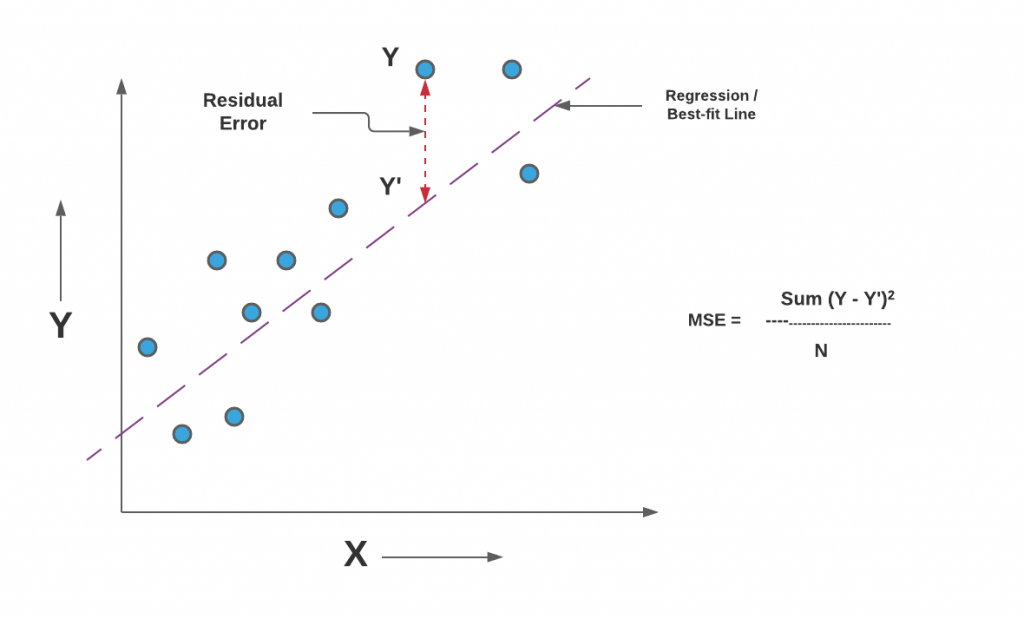
Mathematically, the mean square error (MSE) can be calculated as the average sum of the squared difference between the actual value and the predicted or estimated value represented by the regression model (line or plane). It is also termed as mean squared deviation (MSD). The following is the formula of MSE:
$MSE = \frac{1}{n}\sum_{i=1}^{n}(Y_i – \hat{Y_i})^2$
Where n represents the number of data points, $Y_i$ is the actual value, and $\hat{Y_i}$ is the predicted value.
The value of MSE is always positive. A value close to zero will represent better quality of the estimator/predictor (regression model).
An MSE of zero (0) represents the fact that the predictor is a perfect predictor.
When you take a square root of MSE value, it becomes root mean squared error (RMSE). RMSE has also been termed root mean square deviation (RMSD). In the above equation, Y represents the actual value and the Y_hat represents the predicted value that could be found on the regression line or plane. Here is the diagrammatic representation of MSE for a simple linear or univariate regression model:
Comparing Quality of Regression Models using MSE / RMSE
As discussed earlier in the section, MSE or RMSE can be used to compare the quality of the regression models. Lower the MSE or RMSE, better is the predictive accuracy of the model. The following plot represents the comparison of linear and polynomial regression models.
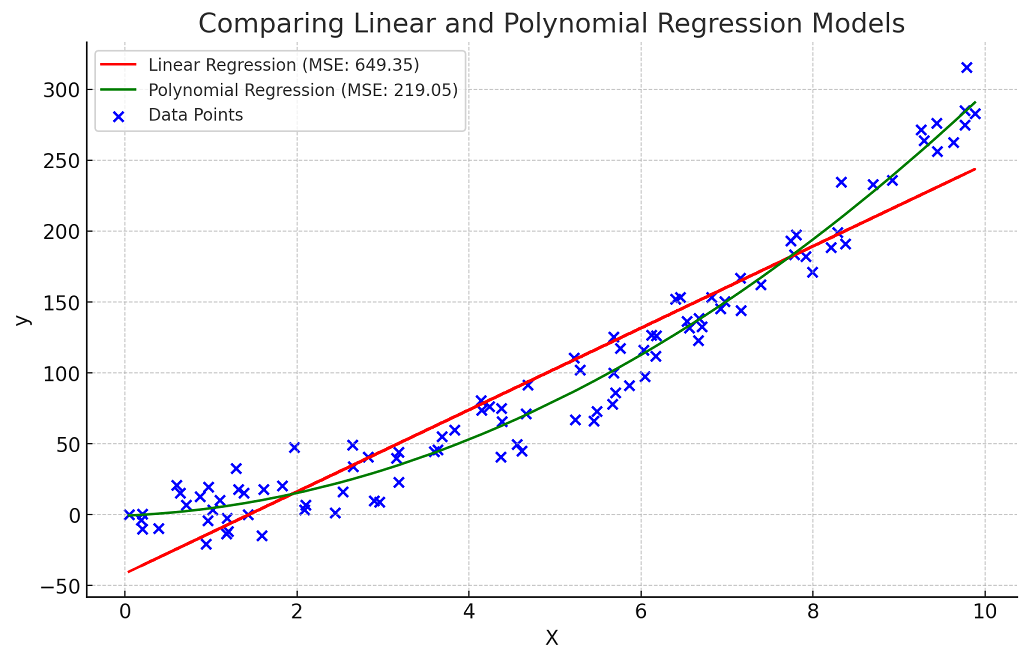
The plot has been updated to represent the Polynomial Regression model with a single, smooth curve:
- The blue dots are the synthetic data points.
- The red line indicates the Linear Regression model, with an MSE of approximately 649.35.
- The green line depicts the Polynomial Regression model (degree 2), now shown as a smooth curve, with an MSE of approximately 219.05.
This visualization clearly illustrates the difference in how each model fits the data, with the Polynomial Regression providing a notably better fit for this particular dataset, as reflected in its lower MSE.
What is a good MSE or RMSE?
The concept of a “good” MSE or RMSE is relative and depends on several factors specific to the context of the data and the model being used. What constitutes a good MSE / RMSE varies based on some of the following:
- Scale of the Data: The range and scale of the target variable significantly impact what is considered a good MSE. For instance, if you’re predicting house prices in the range of hundreds of thousands, an MSE of 1000 might be considered good. In contrast, the same MSE would be poor for a dataset where values range around 10.
- Comparison with Baseline Models: Sometimes, the performance of a model with respect to MSE is assessed relative to a baseline model, like a simple average or a naive forecast. A good MSE would be significantly lower than the MSE of the baseline model.
- Domain-Specific Standards: Different fields have different thresholds for what is considered acceptable in terms of prediction error. For example, in finance, a small error can be very significant, while in other areas, larger errors might be acceptable.
- Comparison with Previous Models: If there are existing models for the same problem, a good MSE would be one that shows an improvement over these models.
What is R-Squared (R2 or R^2)?
R-Squared, also known as the coefficient of determination, is another statistical metric used to evaluate the performance of regression models. It measures the proportion of the total variation in the dependent variable (output) that can be explained by the independent variables (inputs) in the model. Mathematically, that can be represented as the ratio of the sum of squares regression (SSR) and the sum of squares total (SST). Sum of Squares Regression (SSR) represents the total variation of all the predicted values found on the regression line or plane from the mean value of all the values of response variables. The sum of squares total (SST) represents the total variation of actual values from the mean value of all the values of response variables.
R-squared value is used to measure the goodness of fit or best-fit line. The greater the value of R-Squared, the better is the regression model as most of the variation of actual values from the mean value get explained by the regression model.
However, we need to take caution while relying on R-squared. This is where the adjusted R-squared concept comes into the picture. This is discussed in this post – R-squared vs Adjusted R-Squared. For the training dataset, the value of R-squared is bounded between 0 and 1, but it can become negative for the test dataset if the SSE is greater than SST. Greater the value of R-squared would also mean a smaller value of MSE. If the value of R-Squared becomes 1 (ideal world scenario), the model fits the data perfectly with a corresponding MSE = 0. As the value of R-squared increases and become close to 1, the value of MSE becomes close to 0.
Here is a visual representation to understand the concepts of R-Squared in a better manner.
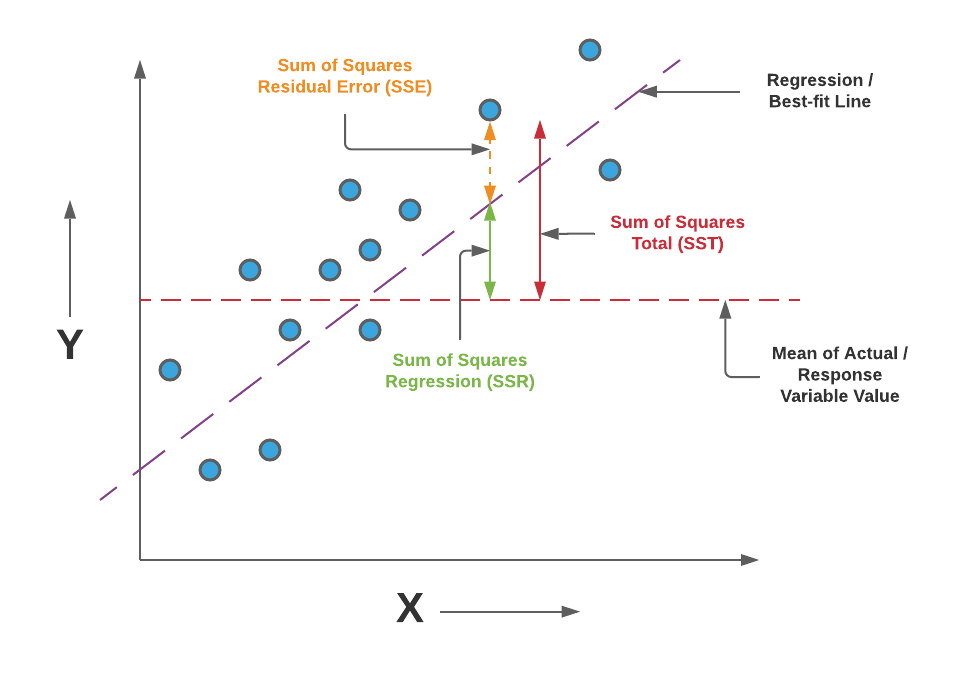
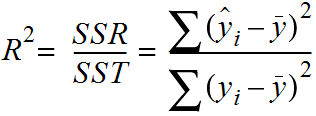
Pay attention to the diagram and note that the greater the value of SSR, the more is the variance covered by the regression / best fit line out of total variance (SST). R-Squared can also be represented using the following formula:
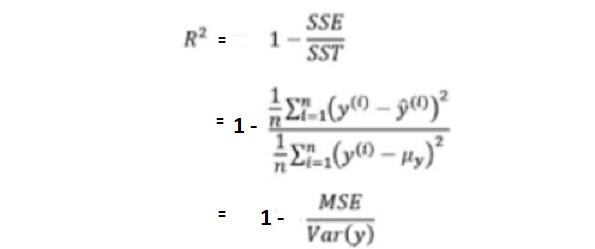
R-Squared = 1 – (SSE/SST)
Pay attention to the diagram and note that the smaller the value of SSE, the smaller is the value of (SSE/SST), and hence greater will be the value of R-Squared. Read further details on R-squared in this blog – R-squared/R2 in linear regression: Concepts, Examples
R-Squared can also be expressed as a function of mean squared error (MSE). The following equation represents the same. You may notice that as MSE increases, the value of R2 will decrease owing to the fact that the ratio of MSE and Var(y) will increase resulting in the decrease in the value of R2.
Why use R-Squared?
The purpose of using R-squared is to assess the model’s explanatory power and determine how well the model fits the data. Some key reasons for using R-squared are:
- Model interpretability: R-squared is easy to understand, as it represents the proportion of the total variation in the data that the model can explain. For example, an R-squared value of 0.8 indicates that 80% of the variation in the dependent variable can be explained by the independent variables in the model.
- Model comparability: R-squared provides a standardized metric to compare the performance of different models or the same model with different sets of independent variables. It allows for an objective evaluation of which model best captures the underlying patterns in the data.
- Model selection: R-squared can help in selecting the most appropriate model when multiple regression models are available. A higher R-squared value generally indicates a better fit, although other factors, such as the complexity of the model and the risk of overfitting, should also be considered.
However, R-squared has some limitations. It can be misleading in cases where the model is too complex or when there is a high degree of multicollinearity among the independent variables. Additionally, a high R-squared value does not necessarily mean the model is accurate in its predictions or suitable for all purposes. In these cases, other performance metrics, such as Mean Squared Error (MSE) or adjusted R-squared, may be more appropriate for evaluating model performance.
Differences: Mean Square Error (MSE) or RMSE vs R-Squared
Mean Squared Error (MSE) and R-squared are both metrics used to evaluate the performance of regression models, but they serve different purposes and convey different information about the model’s accuracy and goodness of fit. Here’s a summary of their differences:
- Interpretation: MSE measures the average squared difference between the predicted and actual values, quantifying the model’s prediction error. Lower MSE values indicate better model accuracy. On the other hand, R-squared measures the proportion of the total variation in the dependent variable that can be explained by the independent variables in the model. Higher R-squared values indicate a better fit between the model’s predictions and the actual observations.
- Scale: MSE is expressed in squared units of the dependent variable, which can make it challenging to compare across different datasets or units of measurement. MSE gets pronounced based on whether the data is scaled or not. For example, if the response variable is housing price in the multiple of 10K, MSE will be different (lower) than when the response variable such as housing pricing is not scaled (actual values). This is where R-Squared comes to the rescue. R-squared is a dimensionless value ranging from 0 to 1, which allows for easy comparison across different models or datasets.
- Sensitivity to outliers: MSE is sensitive to outliers because it squares the differences between predicted and observed values. This means that a model with a few large errors may have a high MSE even if it fits the majority of the data well. On the other hand, R-squared is less sensitive to outliers, as it measures the proportion of the total variation explained by the model, rather than the size of individual errors.
- Purpose: MSE is primarily used to assess the model’s prediction accuracy and is suitable for optimization techniques like gradient descent. On the other hand, R-squared is used to evaluate the model’s goodness of fit and explanatory power, providing insight into how well the model captures the underlying patterns in the data.
MSE or R-Squared – Which one to Use?
It is recommended to use R-Squared or rather adjusted R-Squared for evaluating the model performance of the regression models. This is primarily because R-Squared captures the fraction of variance of actual values captured by the regression model and tends to give a better picture of the quality of the regression model. Also, MSE values differ based on whether the values of the response variable are scaled or not. A better measure instead of MSE is the root mean squared error (RMSE) which takes care of the fact related to whether the values of the response variable are scaled or not.
One can alternatively use MSE or R-Squared based on what is appropriate and the need of the hour. However, the disadvantage of using MSE than R-squared is that it will be difficult to gauge the performance of the model using MSE as the value of MSE can vary from 0 to any larger number. However, in the case of R-squared, the value is bounded between 0 and 1. A value of R-squared closer to 1 would mean that the regression model covers most part of the variance of the values of the response variable and can be termed as a good model. However, with the MSE value, depending on the scale of values of the response variable, the value will be different and hence, it would be difficult to assess for certain whether the regression model is good or otherwise.
If the dataset contains outliers or extreme values that might disproportionately affect the model’s performance, you may prefer R-squared, which is less sensitive to outliers. MSE, on the other hand, is sensitive to outliers because it squares the differences between predicted and observed values.
When comparing multiple models or selecting the most appropriate model for a specific purpose, R-squared can be useful as it provides a standardized metric that ranges from 0 to 1. However, it’s essential to consider other factors, such as model complexity, risk of overfitting, and the purpose of the analysis, when selecting the best model.
You may want to check out my related blog differentiating different types of evaluation metrics for regression models including MSE, RMSE, MAE, MAPE, R-Squared and adjusted R-squared.
MSE or R-Squared Python Code Example
Here is the python code representing how to calculate mean squared error or R-Squared value while working with regression models. Pay attention to some of the following in the code given below:
- Sklearn.metrics mean_squared_error and r2_score is used for measuring the MSE and R-Squared values. Input to this methods are actual values and predicted values.
- Sklearn Boston housing dataset is used for training a multiple linear regression model using Sklearn.linear_model LinearRegression
import pandas as pd
from sklearn.model_selection import train_test_split
from sklearn.preprocessing import StandardScaler
from sklearn.linear_model import LinearRegression
from sklearn.pipeline import make_pipeline
from sklearn.metrics import mean_squared_error, r2_score
from sklearn import datasets
#
# Load the Sklearn Boston Dataset
#
boston_ds = datasets.load_boston()
X = boston_ds.data
y = boston_ds.target
#
# Create a training and test split
#
X_train, X_test, y_train, y_test = train_test_split(X, y, test_size=0.3, random_state=42)
#
# Fit a pipeline using Training dataset and related labels
#
pipeline = make_pipeline(StandardScaler(), LinearRegression())
pipeline.fit(X_train, y_train)
#
# Calculate the predicted value for training and test dataset
#
y_train_pred = pipeline.predict(X_train)
y_test_pred = pipeline.predict(X_test)
#
# Mean Squared Error
#
print('MSE train: %.3f, test: %.3f' % (mean_squared_error(y_train, y_train_pred),
                mean_squared_error(y_test, y_test_pred)))
#
# R-Squared
#
print('R^2 train: %.3f, test: %.3f' % (r2_score(y_train, y_train_pred),
                r2_score(y_test, y_test_pred)))
Conclusions
Here is the summary of what you learned in this post regarding mean square error (MSE) and R-Squared and which one to use?
- MSE represents the residual error which is nothing but sum of squared difference between actual values and the predicted / estimated values divided by total number of records.
- R-Squared represents the fraction of variance captured by the regression model.
- The disadvantage of using MSE is that the value of MSE varies based on whether the values of response variable is scaled or not. If scaled, MSE will be lower than the unscaled values.

Check out my latest book titled as First Principles Thinking: Building winning products using first principles thinking.
- Three Approaches to Creating AI Agents: Code Examples - June 27, 2025
- What is Embodied AI? Explained with Examples - May 11, 2025
- Retrieval Augmented Generation (RAG) & LLM: Examples - February 15, 2025
I found it very helpful. However the differences are not too understandable for me