Tag Archives: python
Covariance vs. Correlation vs. Variance: Python Examples
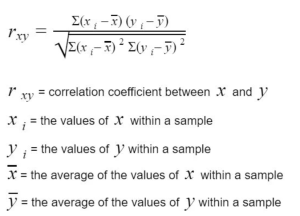
In the field of data science, it’s important to have a strong understanding of statistics and know the difference between related concepts. This is especially true when it comes to the concepts of covariance, correlation, and variance. Whether you’re a data scientist, statistician, or simply someone who wants to better understand the relationships between different variables, it’s important to know the difference between covariance, correlation, and variance. While these concepts may seem similar at first glance, they each have unique applications and serve different purposes. In this blog post, we’ll explore each of these concepts in more detail and provide concrete examples of how to calculate them using Python. What …
Import or Upload Local File to Google Colab
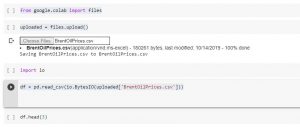
Google Colab is a powerful tool that allows you to run Python code in the cloud. This can be useful for a variety of tasks, including data analysis and machine learning. One of the lesser known features of Google Colab is that you can also import or upload files stored on your local drive. In this article, we will show you how to read a file from your local drive in Google Colab using a quick code sample. There are a few reasons why you as a data scientist might need to learn how to read files from your local drive in Google Colab. One reason is that you may …
Ridge Classification Concepts & Python Examples
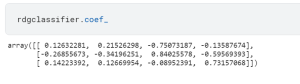
In machine learning, ridge classification is a technique used to analyze linear discriminant models. It is a form of regularization that penalizes model coefficients to prevent overfitting. Overfitting is a common issue in machine learning that occurs when a model is too complex and captures noise in the data instead of the underlying signal. This can lead to poor generalization performance on new data. Ridge classification addresses this problem by adding a penalty term to the cost function that discourage complexity. This results in a model that is better able to generalize to new data. In this post, you will learn about Ridge classifier in detail with the help of …
Pandas Dataframe loc, iloc & brackets examples
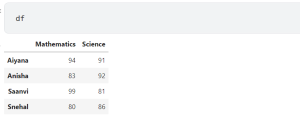
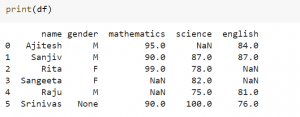
Pandas is a powerful data analysis tool in Python that can be used for tasks such as data cleaning, exploratory data analysis, feature engineering, and predictive modeling. In this article, we will focus on how to use Pandas’ loc and iloc functions on Dataframe, as well as brackets with Dataframe, with examples. As a data scientist or data analyst, it is very important to understand how these functions work and when to use them. In this post, we will work with the following Pandas data frame. Use loc and iloc functions to get Rows of Dataframe The loc function is used to get a particular row in a Dataframe by …
Pandas: How to Create a Dataframe – Examples
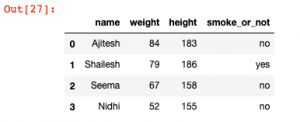
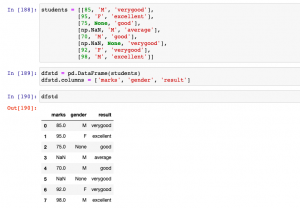
One of the most popular modules for working with data in Python is the Pandas library. Pandas provides data structures and operations for working with structured data. A key concept in Pandas is the Dataframe. Learning how to create and use dataframes is an important skill for anyone including data analysts and data scientists working with data in Python. In this post, you will learn about how to create a Pandas dataframe with some sample data. What is Pandas Dataframe? A Pandas dataframe is a two-dimensional data structure, like a table in a spreadsheet, with columns of data and rows of data. Dataframe is analogous to a table in SQL …
Statistics – Random Variables, Types & Python Examples
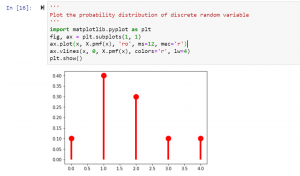
Random variables are one of the most important concepts in statistics. In this blog post, we will discuss what they are, their different types, and how they are related to the probability distribution. We will also provide examples so that you can better understand this concept. As a data scientist, it is of utmost importance that you have a strong understanding of random variables and how to work with them. What is a random variable and what are some examples? A random variable is a variable that can take on random values. The key difference between a variable and a random variable is that the value of the random variable …
How to Create Pandas Dataframe from Numpy Array
Pandas is a library for data analysis in Python. It offers a wide range of features, including working with missing data, handling time series data, and reading and writing data in different formats. Pandas also provides an efficient way to manipulate and calculate data. One of its key features is the Pandas DataFrame, which is a two-dimensional array with labeled rows and columns. A DataFrame is a table-like structure that contains columns and rows of data. Creating a Pandas DataFrame from a NumPy array is simple. In this post, you will get a code sample for creating a Pandas Dataframe using a Numpy array with Python programming. Step 1: Load …
Machine Learning Sklearn Pipeline – Python Example
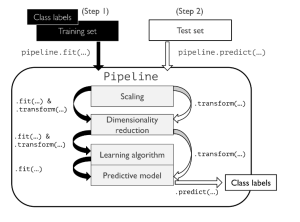
In this post, you will learning about concepts about machine learning (ML) pipeline and how to build ML pipeline using Python Sklearn Pipeline (sklearn.pipeline) package. Getting to know how to use Sklearn.pipeline effectively for training/testing machine learning models will help automate various different activities such as feature scaling, feature selection / extraction and training/testing the models. It is recommended for data scientists (Python) to get a good understanding of Sklearn.pipeline. Introduction to Machine Learning Pipeline & Sklearn.pipeline Machine Learning (ML) pipeline, theoretically, represents different steps including data transformation and prediction through which data passes. The outcome of the pipeline is the trained model which can be used for making the predictions. …
Sample Dataset for Regression & Classification: Python
A lot of beginners in the field of data science / machine learning are intimidated by the prospect of doing data analysis and building regression (linear) & classification models in Python. But with an ability to create sample dataset using Python packages, you can practice your skills and build your confidence over a period of time. The technique demonstrated in this blog post to create and visualize / plot the sample dataset includes datasets that can be used for regression models such as linear regression and classification models such as logistic regression, random forest, SVM etc. You can use this technique to explore different methods for solving the same problem. …
Sklearn SimpleImputer Example – Impute Missing Data
In this post, you will learn about how to use Python’s Sklearn SimpleImputer for imputing / replacing numerical & categorical missing data using different strategies. In one of the related article posted sometime back, the usage of fillna method of Pandas DataFrame is discussed. Handling missing values is key part of data preprocessing and hence, it is of utmost importance for data scientists / machine learning Engineers to learn different techniques in relation imputing / replacing numerical or categorical missing values with appropriate value based on appropriate strategies. SimpleImputer Python Code Example SimpleImputer is a class in the sklearn.impute module that can be used to replace missing values in a dataset, using a …
Pandas dropna: Drop Rows & Columns with Missing Values
In this blog post, we will be discussing Pandas’ dropna method. This method is used for dropping rows and columns that have missing values. Pandas is a powerful data analysis library for Python, and the dropna function is one of its most useful features. As data scientists, it is important to be able to handle missing data, and Pandas’ dropna function makes this easy. Pandas dropna Method Pandas’ dropna function allows us to drop rows or columns with missing values in our dataframe. Find the documentation of Pandas dropna method on this page: pandas.DataFrame.dropna. The dropna method looks like the following: DataFrame.dropna(axis=0, how=’any’, thresh=None, subset=None, inplace=False) Given the above method and parameters, the following …
Perceptron Explained using Python Example

In this post, you will learn about the concepts of Perceptron with the help of Python example. It is very important for data scientists to understand the concepts related to Perceptron as a good understanding lays the foundation of learning advanced concepts of neural networks including deep neural networks (deep learning). What is Perceptron? Perceptron is a machine learning algorithm which mimics how a neuron in the brain works. It is also called as single layer neural network consisting of a single neuron. The output of this neural network is decided based on the outcome of just one activation function associated with the single neuron. In perceptron, the forward propagation of information happens. Deep …
Tensor Explained with Python Numpy Examples
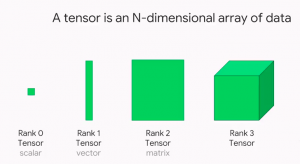
Tensors are a hot topic in the world of data science and machine learning. But what are tensors, and why are they so important? In this post, we will explain the concepts of Tensor using Python Numpy examples with the help of simple explanation. We will also discuss some of the ways that tensors can be used in data science and machine learning. When starting to learn deep learning, you must get a good understanding of the data structure namely tensor as it is used widely as the basic data structure in frameworks such as tensorflow, PyTorch, Keras etc. Stay tuned for more information on tensors! What are tensors, and why are …
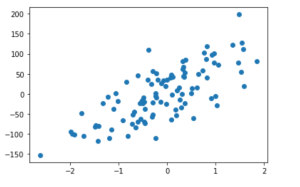
Scatter plot Matplotlib Python Example
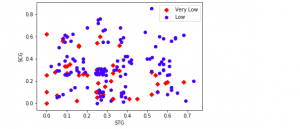
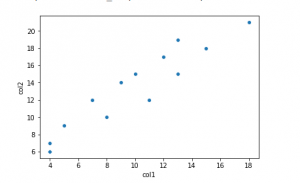
If you’re a data scientist, data analyst or a Python programmer, data visualization is key part of your job. And what better way to visualize all that juicy data than with a scatter plot? Matplotlib is your trusty Python library for creating charts and graphs, and in this blog we’ll show you how to use it to create beautiful scatter plots using examples and with the help of Matplotlib library. So dig into your data set, get coding, and see what insights you can uncover! What is a Scatter Plot? A scatter plot is a type of data visualization that is used to show the relationship between two variables. Scatter …
Softmax Regression Explained with Python Example
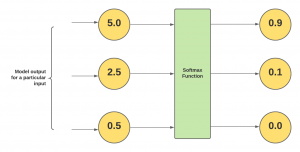
In this post, you will learn about the concepts of what is Softmax regression/function with Python code examples and why do we need them? As data scientist/machine learning enthusiasts, it is very important to understand the concepts of Softmax regression as it helps in understanding the algorithms such as neural networks, multinomial logistic regression, etc in a better manner. Note that the Softmax function is used in various multiclass classification machine learning algorithms such as multinomial logistic regression (thus, also called softmax regression), neural networks, etc. Before getting into the concepts of softmax regression, let’s understand what is softmax function. What’s Softmax function? Simply speaking, the Softmax function converts raw …
Tensor Broadcasting Explained with Examples
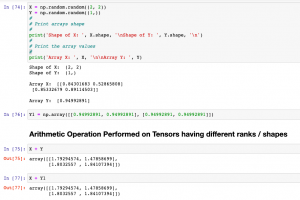
In this post, you will learn about the concepts of Tensor Broadcasting with the help of Python Numpy examples. Recall that Tensor is defined as the container of data (primarily numerical) most fundamental data structure used in Keras and Tensorflow. You may want to check out a related article on Tensor – Tensor explained with Python Numpy examples. Broadcasting of tensor is borrowed from Numpy broadcasting. Broadcasting is a technique used for performing arithmetic operations between Numpy arrays / Tensors having different shapes. In this technique, the following is done: As a first step, expand one or both arrays by copying elements appropriately so that after this transformation, the two tensors have the …
I found it very helpful. However the differences are not too understandable for me