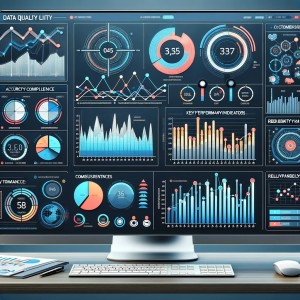
In the digital age, where data is often likened to the new oil, ensuring its quality is not just an operational necessity but a strategic imperative. In every organization, from small startups to global enterprises, the ability to trust and accurately interpret data can be the difference between insightful business decisions and costly missteps. This is where data quality Key Performance Indicators (KPIs) and their visualization through dashboards become pivotal.
In this blog, we aim to navigate you through the multifaceted world of data quality, focusing on understanding, designing, and implementing effective KPI dashboards. Whether you’re a data analyst, a business intelligence professional, or just someone passionate about data-driven decision-making, this guide will provide you with the essential knowledge and tools to elevate your data quality management.
As we delve into the various aspects of data quality KPI dashboards, we’ll start by understanding what these KPIs are and why they matter. We’ll then explore the principles of designing an effective dashboard, followed by best practices and real-world examples. Finally, we’ll discuss the nuts and bolts of integrating and implementing these dashboards into your business processes.
Understanding Data Quality KPIs
Key Performance Indicators (KPIs) for data quality are metrics used to quantitatively measure the effectiveness of data in meeting the set standards of quality. The significance of data quality KPIs lies in their ability to provide a clear and objective measure of data quality. There are several KPIs that are commonly used to measure different aspects of data quality. Here are some of the most critical ones:
- Accuracy: This measures how closely your data reflects the true values. It’s crucial for ensuring that decisions made based on the data are sound. For instance, accuracy in customer contact information can directly impact marketing campaign success.
- Completeness: This KPI assesses whether all necessary data is available. Incomplete data can lead to incomplete analysis, which can be misleading. For example, a customer database missing critical information like email addresses or phone numbers limits communication channels.
- Consistency: Consistency ensures that data across all systems and datasets is the same. Inconsistencies can arise from data being stored in different formats or updated in one system but not another. For example, inconsistent product pricing across different platforms can lead to customer dissatisfaction.
- Reliability: This is about the data being consistently accurate over time. Unreliable data can erode trust and lead to poor business decisions. For instance, sales data that fluctuates inexplicably can mislead forecasting efforts.
- Timeliness: Timeliness refers to data being up-to-date and available when needed. Outdated data can result in missed opportunities or erroneous trends analysis. For instance, stock level data that is not current can lead to overstocking or stockouts.
Data Quality KPIs Dashboard Design & Development
The design and development of a dashboard that accurately reflects KPIs is a crucial step. A well-designed KPI dashboard not only displays data but also tells a story, guiding the viewer to important insights and actions. Designing an effective dashboard involves more than just aesthetic choices; it’s about presenting data in an intuitive and accessible way. Here are some key principles:
- Clarity and Simplicity: The dashboard should be clear and free of clutter. Use simple visualizations that convey information straightforwardly. Avoid overloading the dashboard with too many KPIs or complex charts that can confuse users.
- User-Centric Design: Understand the needs of your dashboard users. Different users might require different levels of detail. Tailor the design to suit the primary users, whether they are data analysts, executives, or IT professionals.
- Consistent Layout: Use a consistent layout and color scheme throughout the dashboard. This consistency helps users quickly locate and comprehend the most critical information.
- Interactivity: Incorporate interactive elements such as filters or drill-down capabilities. This allows users to explore and understand the data at a deeper level.
Tools & Technologies for KPIs Dashboard
Several tools and technologies can aid in the development of a data quality KPI dashboard:
- Business Intelligence (BI) Tools: Platforms like Tableau, Power BI, or Qlik Sense offer powerful capabilities for KPI dashboard creation. They provide a range of visualization options and are user-friendly, making them suitable for users with varying levels of technical expertise.
- Custom Development: For more specific needs, custom KPIs dashboards can be developed using programming languages like JavaScript, along with libraries such as D3.js for advanced data visualization.
- Cloud-Based Solutions: Cloud platforms like Google Data Studio or Amazon QuickSight offer scalable and collaborative KPI dashboard solutions, ideal for teams and remote working scenarios.
Designing for Data Quality KPIs
When designing a dashboard for data quality KPIs, consider the following:
- Select Appropriate Visualizations: Choose chart types that best represent your data quality KPIs. For example, bar charts are great for displaying completeness or accuracy levels, while line charts can effectively show trends over time.
- Prioritize Key Information: Place the most critical KPIs in the most prominent parts of the dashboard. This ensures that users see the most important information first.
- Use Color Wisely: Utilize color to highlight or differentiate data, but be mindful not to overuse it. For instance, using red to denote areas needing attention can immediately draw the user’s eye.
- Provide Context: Where necessary, include brief descriptions or tooltips to help users understand what they are viewing. This is particularly important if the KPIs require specific interpretation.
Data Quality KPIs Dashboard: Best Practices & Examples
Creating a data quality KPI dashboard is more than just a technical exercise; it involves a deep understanding of what makes a dashboard functional, informative, and engaging. Let’s dive into some best practices, followed by real-world examples, to illustrate these principles in action.
- Choose the Right Chart Types: The type of chart should match the nature of the data and the message you want to convey. Use line charts for trend analysis over time, bar charts for comparisons, and pie charts for showing proportions. For instance, a line chart could effectively show the improvement or decline in data accuracy over several months.
- Use of Color: Color can be a powerful tool, but it needs to be used judiciously. Use colors to differentiate data points or to highlight critical issues, like red for areas below target performance. Ensure that the color scheme is consistent and accessible to all users, including those with color vision deficiencies.
- Balanced Layout: Ensure that the dashboard is not too crowded or too sparse. Balance the layout to make it easy for the eyes to scan and find relevant information quickly. Group related KPIs together and use spacing to separate different sections.
- Interactive Elements: Incorporate interactive elements like filters and drill-down options. This allows users to explore the data in more detail, customizing the view to their specific needs or interests.
- Responsive Design: Ensure that the dashboard is accessible on various devices, adapting its layout to different screen sizes for optimum user experience.
Data Quality KPIs Dashboard Examples
Here are few examples of KPIs dashboard for monitoring data quality:
- Retail Inventory Dashboard: Imagine a dashboard used by a retail company to monitor the quality of their inventory data. It could feature KPIs like accuracy of stock levels, completeness of product descriptions, and consistency of pricing across different channels. Interactive elements might allow users to filter by product category or region.
- Customer Data Quality Dashboard: For a company focusing on customer data, the dashboard could highlight KPIs like the completeness of customer contact information, the accuracy of demographic data, and the timeliness of data updates. Visual cues could indicate areas where data quality is below a certain threshold, prompting immediate attention.
- Healthcare Data Dashboard: In a healthcare setting, a dashboard might track the reliability of patient data, the consistency of medical records across departments, and the timeliness of test results. This could help in improving patient care and operational efficiency.
KPIs Dashboard Implementation & Integration
The final step in mastering Data Quality KPI Dashboards is integrating and implementing them within your organization. This step is critical as it ensures that the dashboard is not just a standalone tool but a part of the larger data management ecosystem, actively contributing to data quality improvement. The following are some of the key considerations:
- Integration strategy
- Choosing Data Sources: Begin by identifying the key sources of data that will feed into your dashboard. These could include internal databases, CRM systems, or external data feeds. Ensure that these sources are reliable and can provide the necessary data quality KPIs.
- Data Extraction and Transformation: Use ETL (Extract, Transform, Load) processes to gather data from these sources. This may involve cleaning and transforming the data to ensure consistency and accuracy before it is loaded into the dashboard.
- Real-time vs Batch Processing: Decide whether your dashboard requires real-time data updates or if batch processing suffices. Real-time data is crucial for fast-paced environments where immediate decisions are needed, while batch processing can be adequate for less dynamic KPIs.
- Implementation / Rollout
- Pilot Testing: Before a full rollout, conduct a pilot test with a smaller user group. This helps identify any issues or improvements needed in the dashboard’s design or functionality.
- Training and User Adoption: Ensure that users understand how to use the dashboard effectively. This might involve training sessions, user manuals, or help guides. User adoption is key to the dashboard’s success, so it’s important to address any user concerns or feedback promptly.
- Feedback Loop: Establish a feedback mechanism where users can report issues or suggest improvements. This iterative process helps in continuously refining the dashboard.
- Performance Monitoring: Regularly monitor the dashboard’s performance, both in terms of technical aspects (like load times) and its effectiveness in improving data quality. Make adjustments as necessary to maintain its relevance and efficiency.
- Integration with Business Processes:
- Embedding in Decision-Making: Integrate the dashboard insights into regular business processes and decision-making. Ensure that it becomes a part of the routine checks and balances within the organization.
- Automated Alerts and Reports: Set up automated alerts for critical data quality issues identified by the dashboard. This ensures immediate action where necessary. Additionally, regular reports can be generated for management review.
- Scalability and Flexibility: As your organization grows, so will your data quality needs. Ensure that your dashboard can scale and adapt to these changing requirements.

Check out my latest book titled as First Principles Thinking: Building winning products using first principles thinking.
- Questions to Ask When Thinking Like a Product Leader - July 3, 2025
- Three Approaches to Creating AI Agents: Code Examples - June 27, 2025
- What is Embodied AI? Explained with Examples - May 11, 2025
I found it very helpful. However the differences are not too understandable for me