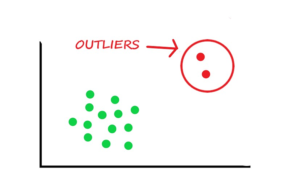
In the realm of data science, mastering outlier detection techniques is paramount for ensuring data integrity and robust machine learning model performance. Outliers are the data points which deviate significantly from the norm. The outliers data points can greatly impact the accuracy and reliability of statistical analyses and machine learning models. In this blog, we will explore a variety of outlier detection techniques using Python. The methods covered will include statistical approaches like the z-score method and the interquartile range (IQR) method, as well as visualization techniques like box plots and scatter plots. Whether you are a data science enthusiast or a seasoned professional, it is important to grasp these concepts to identify and handle outliers effectively. Let’s dive in!
What are different outlier detection techniques?
Outlier detection techniques are essential tools that data scientists could use for identifying and handling data points that deviate significantly from the norm. In this section, we will explore two prominent categories of outlier detection techniques: statistical approaches and visualization approaches.
Statistical Technique: Z-score Method
The z-score method measures the number of standard deviations a data point is away from the mean of a distribution. It identifies outliers as data points that fall outside a specified threshold (typically, a z-score threshold of 2 or 3). Let’s say we have a dataset of student heights. By calculating the z-score for each height measurement, we can identify any students whose height significantly deviates from the mean, indicating potential outliers.
Why & when? The z-score method is generally useful when working with normally distributed data. It helps identify data points that are unusually far from the mean and can be effective in detecting outliers that are characterized by extreme values. It should be noted that while the Z-score method is often applied to data that follows a normal distribution, it can still be useful for outlier detection in other types of distributions as well. In non-normal distributions, the Z-scores may not represent the exact number of standard deviations from the mean. Nevertheless, the Z-scores can still provide a relative measure of how far each data point deviates from the average or central tendency of the data.
Statistical Technique: Interquartile Range (IQR) Method
The IQR method involves calculating the spread of the data by determining the range between the first quartile (25th percentile) and the third quartile (75th percentile) of a distribution. Outliers are identified as data points that fall below the first quartile minus a specified threshold or above the third quartile plus the threshold (typically, 1.5 times the IQR). Consider a dataset of housing prices in a city. By calculating the IQR and applying a threshold, we can identify houses that are priced significantly lower or higher than the typical range, indicating potential outliers.
Why & when? The IQR method is robust against extreme values and is useful when dealing with non-normally distributed data. It helps detect outliers based on the spread of the data, making it particularly suitable for skewed or heavy-tailed distributions.
Visualization technique: Box plot
A box plot, also known as a box-and-whisker plot, provides a visual representation of the distribution of a dataset. It displays the quartiles, median, and potential outliers. Outliers are represented as individual data points outside the whiskers. Imagine analyzing the exam scores of students in a class. A box plot can reveal any unusually low or high scores that fall outside the whiskers, helping identify potential outliers.
Why & when? Box plots are useful for comparing multiple distributions or identifying outliers in a single dataset. They provide a compact visualization that highlights the spread and skewness of the data, making it easier to spot potential outliers.
Visualization technique: Scatter plot
A scatter plot displays the relationship between two variables as a collection of points. It can help identify outliers by visualizing data points that deviate significantly from the overall pattern or cluster of points. Suppose we have a dataset containing the age and income of individuals. A scatter plot can reveal any individuals with exceptionally high or low income relative to their age group, indicating potential outliers.
Why & when? Scatter plots are effective when exploring the relationship between two continuous variables. They allow for the visual identification of outliers and provide insights into the overall patterns and trends within the data.
Statistical Techniques (Z-Score or IQR) using Python
In this section, we will explore the application of statistical techniques, namely the Z-Score and Interquartile Range (IQR) methods, using Python for outlier detection. Python code will be used for the following purpose:
- Calculate z-scores and define thresholds for identifying outliers based on the number of standard deviations from the mean.
- Calculate the IQR and leverage it to identify outliers using Python libraries such as NumPy and Pandas
Z-score Method of detecting outliers & Python Example
We will use the Iris dataset to demonstrate how the Z-score method can be used for outlier detection using Python. The Iris dataset contains measurements of sepal length, sepal width, petal length, and petal width for three different species of Iris flowers. Here is the Python code that showcases the implementation of the Z-score method for outlier detection in the Iris dataset:
import pandas as pd
import numpy as np

# Load the Iris dataset
iris_df = pd.read_csv("https://raw.githubusercontent.com/uiuc-cse/data-fa14/gh-pages/data/iris.csv")

# Extract the column of interest for outlier detection (e.g., sepal length)
column_name = "sepal_length"
data = iris_df[column_name]

# Calculate the Z-scores
z_scores = (data - data.mean()) / data.std()

# Define a threshold for identifying outliers (e.g., Z-score threshold of 2)
threshold = 2

# Identify the outliers
outliers = iris_df[abs(z_scores) > threshold]

# Print the outliers
print("Outliers:")
print(outliers)
In the above code, outliers data based on sepal length was detected. The Iris dataset was loaded using the read_csv function from the pandas library. The column such as sepal_length was extracted. The Z-scores was calculated for the sepal length measurements by subtracting the mean and dividing by the standard deviation. Next, a threshold was defined which is set to a Z-score of 2 in this code example. Any data point with a Z-score greater than this threshold is considered an outlier. This is what got printed as an output.

IQR Method of detecting outliers & Python Example
The Interquartile Range (IQR) method is a robust statistical approach for detecting outliers that is not reliant on data distribution assumptions. In this section, we will explore how to implement the IQR method using Python. We will use the Wine Quality dataset, which contains information about various attributes of different wines, as an example to demonstrate how the IQR method can be used for outlier detection using Python.
import pandas as pd

# Load the Wine Quality dataset
wine_df = pd.read_csv("https://archive.ics.uci.edu/ml/machine-learning-databases/wine-quality/winequality-red.csv", sep=";")

# Extract the column of interest for outlier detection (e.g., alcohol content)
column_name = "alcohol"
data = wine_df[column_name]

# Calculate the IQR
Q1 = data.quantile(0.25)
Q3 = data.quantile(0.75)
IQR = Q3 - Q1

# Define a threshold for identifying outliers (e.g., 1.5 times the IQR)
threshold = 1.5

# Identify the outliers
outliers = wine_df[(data < Q1 - threshold * IQR) | (data > Q3 + threshold * IQR)]

# Print the outliers
print("Outliers:")
print(outliers)
In the above code, outliers data based on alcohal content was detected. The wine quality dataset was loaded using the read_csv function from the pandas library. The column such as alcohal was extracted. The quartiles (Q1 and Q3) was calculated along with the interquartile range (IQR) for the alcohol content measurements. A threshold, which is set to 1.5 times the IQR was defined in this example. Any data point that falls below Q1 minus the threshold times IQR or above Q3 plus the threshold times IQR is considered an outlier. The outliers in the dataset was identified and printed by selecting the corresponding rows from the original Wine Quality dataframe using boolean indexing.

Visualization Techniques (Boxplot or Scatterplot) using Python
Visualization techniques, such as box plots and scatter plots, can be used for detecting outliers and gaining insights into the underlying patterns and distributions of data. In this section, we will explore how to leverage these visualization techniques using Python. We will provide Python code examples (using Matplotlib & Seaborn) that demonstrate how to create box plots and scatter plots, interpret their features, and identify outliers visually.
Boxplot for detecting outliers & Python Example
The following code demonstrates how to create box plots and interpret their features to identify outliers effectively. In the code below, the “Titanic” dataset is used. The dataset which contains information about passengers aboard the ill-fated RMS Titanic. We will focus on the “Age” feature and use it to demonstrate the box plot for outlier detection.
import pandas as pd
import seaborn as sns
import matplotlib.pyplot as plt

# Load the Titanic dataset
titanic_df = pd.read_csv("https://raw.githubusercontent.com/datasciencedojo/datasets/master/titanic.csv")

# Create a box plot of the "Age" feature
sns.boxplot(x=titanic_df["Age"])

# Add labels and title to the plot
plt.xlabel("Age")
plt.title("Box Plot of Age")

# Display the plot
plt.show()
The following box plot gets printed.
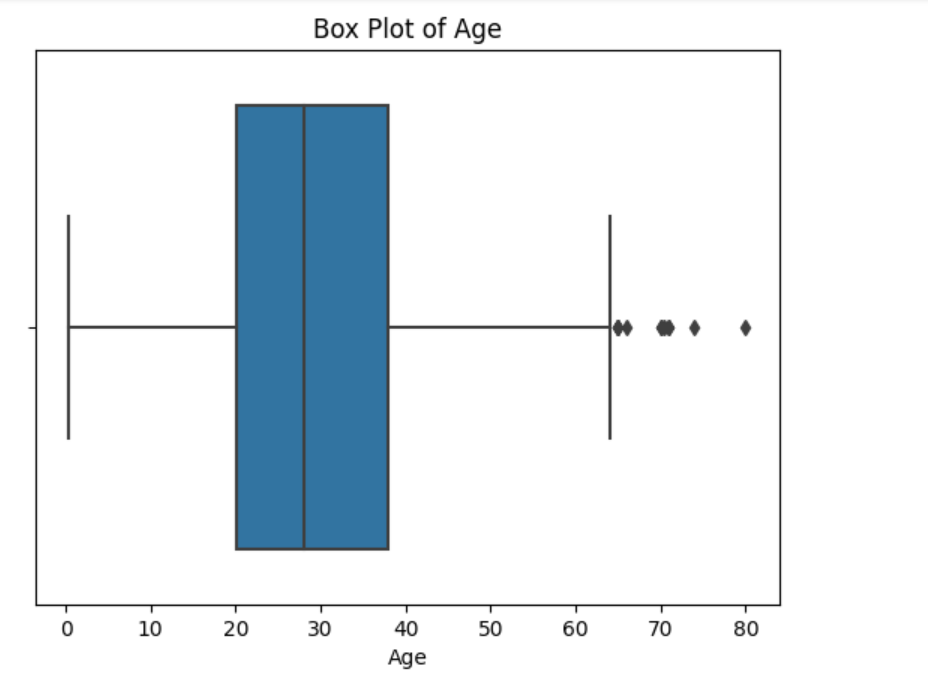
Note some of the following in the above box plot:
- By examining the above box plot, we can detect outliers as data points that fall outside the whiskers, which represent the range of typical values. Outliers can be visually distinguished as individual points beyond the whiskers’ reach.
- The whiskers extend to the minimum and maximum values within 1.5 times the IQR from the first and third quartiles, respectively. Any data points beyond the whiskers are considered potential outliers.
Scatterplot for detecting outliers & Python Example
A scatter plot is a valuable visualization technique for detecting outliers and understanding the relationship between two continuous variables. In this section, we will explore how to utilize scatter plots for outlier detection using Python. The following Python code example demonstrates how to create scatter plots, interpret their features, and identify outliers visually. The “Boston Housing” dataset is used for demo purpose. The dataset contains information about various factors influencing housing prices in Boston. In the example below, the “RM” (average number of rooms per dwelling) and “MEDV” (median value of owner-occupied homes) features are used to demonstrate the scatter plot for outlier detection.
import pandas as pd
import matplotlib.pyplot as plt

# Load the Boston Housing dataset
boston_df = pd.read_csv("https://raw.githubusercontent.com/selva86/datasets/master/BostonHousing.csv")

# Create a scatter plot of "RM" versus "MEDV"
plt.scatter(boston_df["rm"], boston_df["medv"])

# Add labels and title to the plot
plt.xlabel("Average Number of Rooms per Dwelling (RM)")
plt.ylabel("Median Value of Owner-occupied Homes (MEDV)")
plt.title("Scatter Plot: RM vs. MEDV")

# Display the plot
plt.show()
The following scatter plot gets printed.
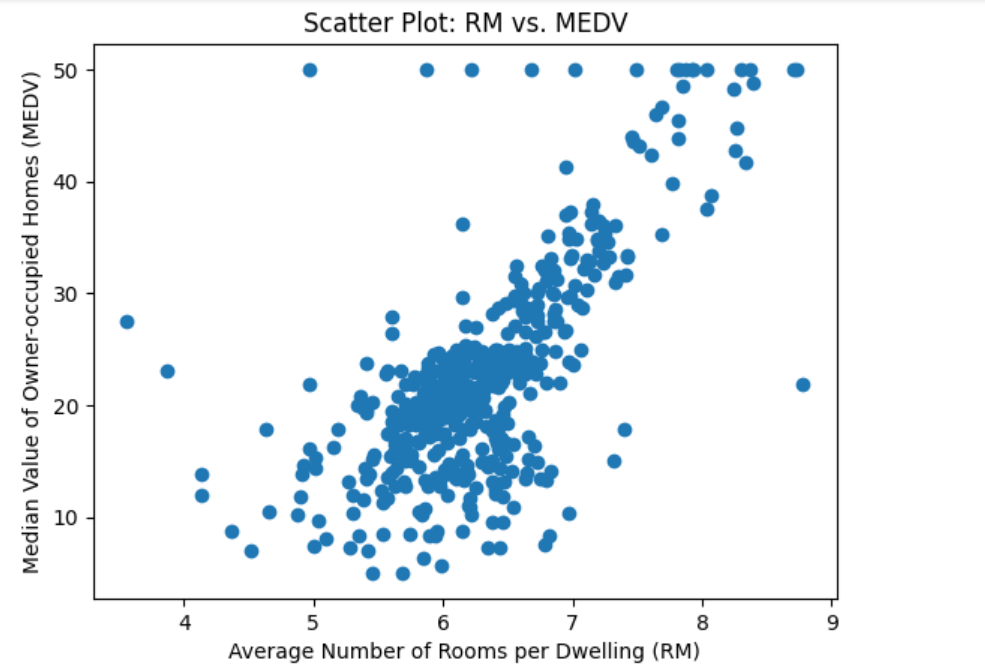
By examining the above scatter plot, we can visually identify potential outliers as data points that deviate significantly from the general trend or cluster of points. Outliers can be distinguished as individual points that lie far away from the majority of the data.
Conclusion
In this blog, we delved into outlier detection techniques using Python, showcasing the power of data cleaning for ensuring reliable data analyses. The statistical techniques covered included the Z-score method and the IQR method, which employ statistical measures to identify outliers based on deviations from the mean or quartiles. The visualization techniques covered included box plots and scatter plots, providing intuitive ways to detect outliers visually and gain insights into data patterns. By combining these techniques, data scientists can make informed decisions, improve analysis accuracy, and gain valuable insights from their datasets.

Check out my latest book titled as First Principles Thinking: Building winning products using first principles thinking.
- Questions to Ask When Thinking Like a Product Leader - July 3, 2025
- Three Approaches to Creating AI Agents: Code Examples - June 27, 2025
- What is Embodied AI? Explained with Examples - May 11, 2025
I found it very helpful. However the differences are not too understandable for me