Tag Archives: Data Science
Chi-square test – Formula, Concepts, Examples

The Pearson’s Chi-square (χ2) test is a statistical test used to determine whether the distribution of observed data is consistent with the distribution of data expected under a particular hypothesis. The Chi-square test can be used to compare or evaluate the independence of two distributions, or to assess the goodness of fit of a given distribution to observed data. In this blog post, we will discuss different types of Chi-square tests, the concepts behind them, and how to perform them using Python / R. As data scientists, it is important to have a strong understanding of the Chi-square test so that we can use it to make informed decisions about …
Microsoft’s Free Courses: Data Science, Machine Learning, AI
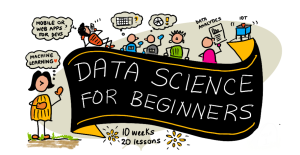
Are you keen on diving into the world of data science, machine learning, or artificial intelligence? Have you been searching for courses that not only teach the fundamentals but are also free and accessible? Look no further! Microsoft has put together three distinct courses that will cater to your interests and ignite your passion for learning. Data Science for Beginners This course offers an ideal starting point for those new to data science, focusing on the basics and guiding through practical exercises. The course would help you demystify the complex world of data, allowing you to make informed decisions in various fields such as business, healthcare, and more. Each lesson …
Hypothesis Testing Steps & Examples
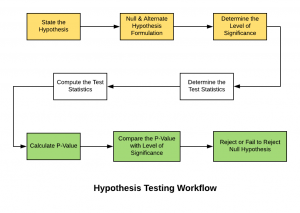
Hypothesis testing is a technique that helps scientists, researchers, or for that matter, anyone test the validity of their claims or hypotheses about real-world or real-life events in order to establish new knowledge. Hypothesis testing techniques are often used in statistics and data science to analyze whether the claims about the occurrence of the events are true, whether the results returned by performance metrics of machine learning models are representative of the models or they happened by chance. This blog post will cover some of the key statistical concepts including steps and examples in relation to what is hypothesis testing, how to formulate them and how to use them in …
7 Free MIT AI / Machine Learning Courses: Enroll Now!

Are you eager to dive into the world of machine learning and AI but worried about the costs? Are you fascinated by how data analytics can shape the future of various industries? What if you could access top-notch education from one of the leading institutions in the world, absolutely free? In the next six months, MIT is offering seven upcoming free courses designed to equip you with the knowledge and skills in machine learning, AI, and data analytics. Whether you’re a seasoned professional looking to upskill or a beginner ready to embark on a new journey, these courses provide an incredible opportunity. In this blog, we’ll delve into the details …
IIT Madras Fellowship in AI for Social Good
Are you an AI researcher driven by the passion to make a positive impact on society? Do you seek to use your knowledge in machine learning and AI to contribute to real-world issues? Are you intrigued by the idea of joining a leading interdisciplinary research center for data science in India? Then here is the opportunity to discover a unique opportunity that aligns with your aspirations and expertise at the Robert Bosch Centre for Data Science and Artificial Intelligence (RBCDSAI), IIT Madras. Apply Now for fellowship program in AI for social good. About RBCDSAI RBCDSAI is one of India’s pre-eminent interdisciplinary research academic centers specializing in Data Science and AI. …
Machine Learning Projects for Final Year Students: Examples
As aspiring data scientists, computer scientists, and statisticians, the final year of your academic journey presents a perfect opportunity to showcase your skills and knowledge in practical applications. In this blog, we will explore a diverse set of exciting machine-learning projects that are well-suited for final-year students. These projects cover various domains, including education, healthcare, crime prediction, and more. We will delve into each project’s description, problem type (classification, regression, etc.), and the methods used for analysis. Whether you are seeking inspiration for your final year project or simply eager to explore the power of machine learning in real-world scenarios, this blog has something for everyone! In case you would …
NPTEL’s Machine Learning & Data Science Online Courses (Jul-Nov 2023)

In the rapidly evolving domains of Machine Learning, Data Science, and Artificial Intelligence, the quest for quality education and courses has become paramount. For those familiar with the educational landscape of India, the Indian Institutes of Technology (IITs) stand out as beacons of excellence. Established by the government of India, the IITs are autonomous public technical universities that are recognized globally for their outstanding curriculum, research, and innovation. Every year, thousands of students vie for a coveted spot in these institutions, and their alumni have made significant contributions to technology and research worldwide. NPTEL (National Programme on Technology Enhanced Learning), in collaboration with these premier IITs, has curated a range …
Autoregressive (AR) Models Python Examples: Time-series Forecasting
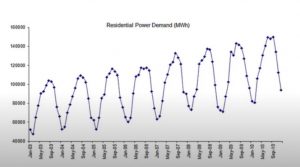
Autoregressive (AR) models, which are used for text generation tasks and time series forecasting, can be employed to predict future values predicated on previous observations. This blog post will provide the concepts of autoregressive (AR) models with Python code examples to demonstrate how you can implement an AR model for time-series forecasting. Note that time-series forecasting is one of the important areas of data science/machine learning. In subsequent blogs, we will take up the topic of how autoregressive models can be used as generative model for text generation tasks. For beginners, time-series forecasting is the process of using a model to predict future values based on previously observed values. Time-series data …
Generative Adversarial Network (GAN): Concepts, Examples

In this post, you will learn concepts & examples of generative adversarial network (GAN). The idea is to put together key concepts & some of the interesting examples from across the industry to get a perspective on what problems can be solved using GAN. As a data scientist or machine learning engineer, it would be imperative upon us to understand the GAN concepts in a great manner to apply the same to solve real-world problems. This is where GAN network examples will prove to be helpful. What is Generative Adversarial Network (GAN)? We will try and understand the concepts of GAN with the help of a real-life example. Imagine that …
Sign Test Hypothesis: Python Examples, Concepts
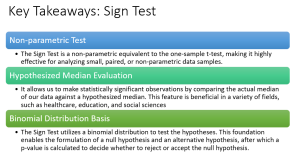
Have you ever wanted to make an informed decision, but all you have is a small amount of non-parametric data? In the realm of statistics, we have various tools that enable us to extract valuable insights from such datasets. One of these handy tools is the Sign test, a beautifully simple yet potent method for hypothesis testing. Sign test is a non-parametric test which is often seen as a cousin to the one-sample t-test, allows us to infer information about a whole population based on a small, paired sample. It is particularly useful when dealing with dichotomous data – Data that can have only two possible outcomes. In this blog …
K-Means Clustering Concepts & Python Example
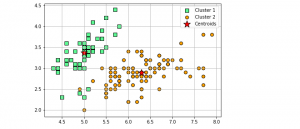
Clustering is a popular unsupervised machine learning technique used in data analysis to group similar data points together. The K-Means clustering algorithm is one of the most commonly used clustering algorithms due to its simplicity, efficiency, and effectiveness on a wide range of datasets. In K-Means clustering, the goal is to divide a given dataset into K clusters, where each data point belongs to the cluster with the nearest mean value. The algorithm works by iteratively updating the cluster centroids until convergence is achieved. In this post, you will learn about K-Means clustering concepts with the help of fitting a K-Means model using Python Sklearn KMeans clustering implementation. You will …
Mann-Whitney U Test (Wilcoxon Rank Sum): Python Example
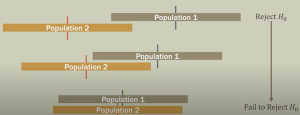
In the ever-evolving world of data science, extracting meaningful insights from diverse data sets is a fundamental task. However, a significant problem arises when these data sets do not conform to the assumptions of normality and equal variances, rendering popular parametric tests like the t-test ineffectual. Real-world data often tends to be skewed, includes outliers, or originates from an unknown distribution. For instance, data related to salaries, house prices, or user behavior metrics often challenge traditional statistical methods. This is where the Wilcoxon Rank Sum Test, also known as the Mann-Whitney U test, proves to be an invaluable statistical test. As a non-parametric alternative to the independent two-sample t-test, it …
Types of Data Visualization: Charts, Plots Examples
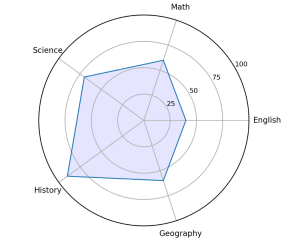
In today’s data-driven world, the ability to extract insights from vast amounts of information has become a critical skill for data scientists and analysts. Visualizing data through charts, graphs, and other types of visual representations can help them uncover patterns and relationships that might be difficult to spot otherwise. However, not all visualizations are created equal, and choosing the right type of visualization can make all the difference in communicating insights effectively. That’s why understanding the different types of visualization available is crucial for data visualization experts and data scientists. In this blog, we’ll explore some of the most common types of visualization, including comparison plots, relation plots, composition plots …
Machine Learning Use Cases in Finance: Concepts & Examples

What if we can build solutions that could predict financial market trends, assess credit risk with unerring precision, detect fraudulent activities before they occur, and significantly automate your day-to-day operations? Such solutions can be called as predictive analytics solutions which leverages AI / machine learning for making predictions. Machine learning has found its way into finance and is being used in various ways to improve the industry. Finance has always been a data-driven industry, and in recent years, machine learning has become an increasingly important tool for making sense of that data. In this blog post, we will explore some of these use cases and explain how machine learning is …
Kruskal Wallis H Test Formula, Python Example
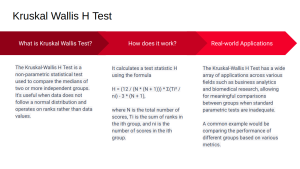
Ever wondered how to find out if different groups of people have different preferences? Maybe you’re a marketer trying to understand if different age groups prefer different features in a smartphone. Or perhaps you’re a public policy researcher, trying to determine if different neighborhoods are equally satisfied with their local services. How do you go about answering these questions, especially when the data doesn’t follow the typical bell-shaped curve or normal distribution? The solution lies in the Kruskal-Wallis H Test! This is a non-parametric test that helps to compare more than two independent groups and it comes in really handy when the data is not bell-shaped curve data or not …
Weighted Regression Model Python Examples
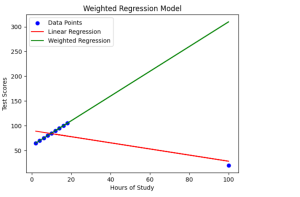
Have you ever wondered how regression models can be enhanced to provide more accurate predictions, even in the presence of outliers or data points with varying significance? Enter weighted regression machine learning models, an approach that assigns weights to data points, allowing for precise adjustments and improvements in prediction accuracy. In this blog post, we will learn about the concepts of weighted regression models with the help of examples while demonstrating with the help of Python implementation. Traditional linear regression is a widely-used technique, but it may struggle when faced with outliers or situations where some data points carry more weight than others. However, weighted regression models help overcome these …

I found it very helpful. However the differences are not too understandable for me