Tag Archives: Data Science
Standard Deviation vs Standard Error: Formula, Examples
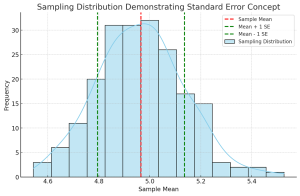
Understanding the differences between standard deviation and standard error is crucial for anyone involved in statistical analysis or research. These concepts, while related, serve different purposes in the realm of statistics. In this blog, we will delve into their differences, applications in research, formulas, and practical examples. Introduction to Standard Deviation & Standard Error At the heart of statistical analysis lies the need to understand and quantify variability. This is where standard deviation and standard error come into play. What’s standard deviation? Standard Deviation is a measure that reflects the amount of variation or dispersion within a dataset. It indicates how much individual data points deviate from the mean (average) …
Coefficient of Variation vs Standard Deviation
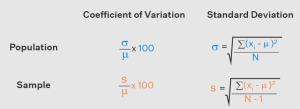
Last updated: 28th Nov, 2023 Understanding the difference between coefficient of variation (CV) and standard deviation (SD) is essential for statisticians and data scientists. While both concepts measure variability in a dataset, they are calculated differently and can be used in different scenarios for better understanding. Here, we will explore the coefficient of variation vs standard deviation differences to gain a better understanding of how to use them. Coefficient of Variation vs Standard Deviation Coefficient of Variation (CV) is a measure that is used to compare the amount of variation in a dataset relative to its mean value. It is calculated by taking the standard deviation divided by the mean, then …
Classification Problems in Machine Learning: Examples

In this post, you will learn about some popular and most common real-life examples of machine learning (ML) classification problems. For beginner data scientists, these examples of classification problems will prove to be helpful to gain perspectives on real-world problems which can be solved using classification algorithms in machine learning. This post will be updated from time-to-time to include interesting examples which can be solved by training classification models. Before going ahead and looking into examples, let’s understand a little about what is an ML classification problem. You may as well skip this section if you are familiar with the definition of machine learning classification problems & solutions. You may …
Z-test vs T-test vs Chi-square test: Differences, Examples
In the world of data science, understanding the differences between various statistical tests is crucial for accurate data analysis. Three most popular tests – the Z-test, T-test, and Chi-square test – each serve specific purposes. This blog post will delve into their definitions, types, formulas, appropriate usage scenarios, and the Python/R packages that can be used for their implementation, along with real-world examples. Check out a detailed post on the differences between Z-test vs T-test. Definition: What’s Z-test vs T-test vs Chi-square test? The following represents the definition of each of the tests along with a real-world example: Z-test: The Z-test is a statistical test used to determine if there …
Learning Curves Python Sklearn Example
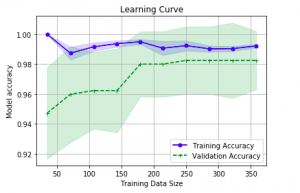
Last updated: 26th Nov, 2023 In this post, you will learn about how to use learning curves to assess the improvement in learning performance (accuracy, error rate, etc.) of a machine learning model while implementing using Python (Sklearn) packages. Knowing how to use learning curves will help you assess/diagnose whether the model is suffering from high bias (underfitting) or high variance (overfitting) and whether increasing training data samples could help solve the bias or variance problem. You may want to check some of the following posts in order to get a better understanding of bias-variance and underfitting-overfitting. Bias-variance concepts and interview questions Overfitting/Underfitting concepts and interview questions What are learning curves? …
Procurement Analytics Use Cases Examples

Last updated: 26th Nov, 2023 The procurement analytics applications is seeing tremendous growth in last few years. With so much data available, advancement in data analytics and related technology field, and the need for digital transformation across procurement organizations, it’s important to know how procurement analytics can help you make better business decisions. This blog will cover procurement analytics and key use cases examples from advanced analytics field such as machine learning, AI, generative AI that will be useful for business stakeholders such as category managers, sourcing managers, supplier relationship managers, business analysts/product managers, and data scientists to implement different use cases using machine learning. The use cases around data-driven decision …
Data Science Explained: Framework, Methods, Examples
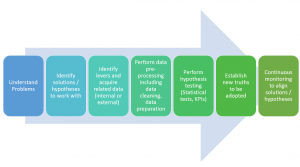
What is data science? This is a question that many people who are planning to start learning data science are asking, and for good reason. Data science is increasingly being applied to solve real-world issues, encompassing a broad range of areas. In this blog post, we’re going to explore data science: what it is, the methods it employs, and how it’s applied to solve various problems, with relevant examples. Stick with us, and by the end of this post, you’ll gain a comprehensive understanding of data science and its significance! What is Data Science? Before understanding what is data science, let’s understand what is science? Science can be defined as …
Bagging Classifier Python Code Example
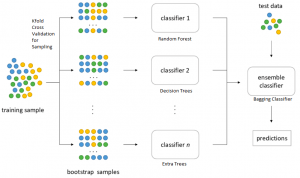
Last updated: 25th Nov, 2023 Bagging is a type of an ensemble machine learning approach that combines the outputs from many learner to improve performance. The bagging algorithm works by dividing the training set into smaller subsets. These subsets are then processed through different machine-learning models. After processing, the predictions from each model are combined. This combination of predictions is used to generate an overall prediction for each instance in the original data. In this blog post, you will learn about the concept of Bagging along with Bagging Classifier Python code example. Bagging can be used in machine learning for both classification and regression problem. The bagging classifier technique is utilized across a …
Activation Functions in Neural Networks: Concepts, Examples
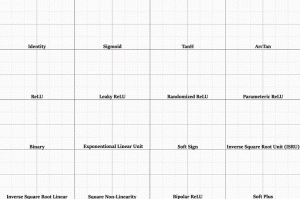
Last updated: 24th Nov, 2023 The activation functions are critical to understanding neural networks. There are many activation functions available for data scientists to choose from, when training neural networks. So, it can be difficult to choose which activation function will work best for their needs. In this blog post, we look at different activation functions and provide examples of when they should be used in different types of neural networks. If you are starting on deep learning and wanted to know about different types of activation functions, you may want to bookmark this page for quicker access in the future. What are activation functions in neural networks? In a …
PCA Explained Variance Concepts with Python Example
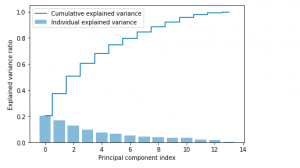
Last updated: 24th Nov, 2023 Dimensionality reduction is an important technique in data analysis and machine learning that allows us to reduce the number of variables in a dataset while retaining the most important information. By reducing the number of variables, we can simplify the problem, improve computational efficiency, and avoid overfitting. Principal Component Analysis (PCA) is a popular dimensionality reduction technique that aims to transform a high-dimensional dataset into a lower-dimensional space while retaining most of the information. PCA works by identifying the directions that capture the most variation in the data and projecting the data onto those directions, which are called principal components. However, when we apply PCA, …
R-squared & Adjusted R-squared: Differences, Examples
There are two measures of the strength of linear regression models: adjusted r-squared and r-squared. While they are both important, they measure different aspects of model fit. In this blog post, we will discuss the differences between adjusted r-squared and r-squared, as well as provide some examples to help illustrate their meanings. As a data scientist, it is of utmost importance to understand the differences between adjusted r-squared and r-squared in order to select the most appropriate linear regression model out of different regression models. What is R-squared? R-squared, also known as the coefficient of determination, is a measure of what proportion of the variance in the value of the …
Feature Scaling in Machine Learning: Python Examples
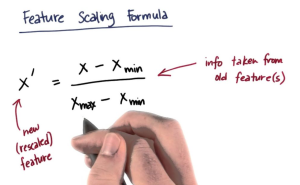
While training machine learning models, we come across the need for scaling features in order to have different features contribute to the predictions in an appropriate manner. Without scaling, features with larger numerical ranges can dominate those with smaller ranges, leading to biased or inefficient learning. In this post you will learn about this feature engineering technique namely feature scaling with Python code examples using which you could significantly improve performance of machine learning models. To demonstrate the technique, the models will be trained using Perceptron (single-layer neural network) classifier. What is Feature Scaling? Why is it needed? Feature scaling is a method used to standardize the range of independent variables …
Different Types of Statistical Tests: Concepts

Last updated: 18th Nov, 2023 Statistical tests are an important part of data analysis. They help us understand the data and make inferences about the population. They are used to examine relationships between variables based on hypothesis testing. They are a way of analyzing data to see if there is a significant difference between the two groups or a group and population. In statistics, there are two main types of tests: parametric and non-parametric. Both types of tests are used to make inferences about a population based on a sample. The difference between the two types of tests lies in the assumptions that they make about the data. Parametric tests …
Machine Learning – Sensitivity vs Specificity Differences, Examples
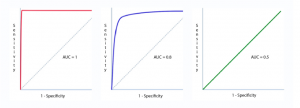
Last updated: 18th Nov, 2023 Machine learning (ML) models are increasingly being used to learn from data and make decisions or predictions based on that learning. When it comes to evaluating the performance of these ML models, there are several important metrics to consider. One of the most important metrics is the accuracy of the model, which is typically measured using sensitivity and specificity. Sensitivity and specificity are two important concepts often used in the context of classification tasks in machine learning. They help to evaluate the performance of a classification model. In this post, we will try and understand the concepts behind machine learning model evaluation metrics such as …
PCA vs LDA Differences, Plots, Examples
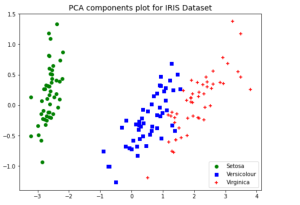
Last updated: 18th Nov, 2023 Dimensionality reduction is an important technique in data analysis and machine learning that allows us to reduce the number of variables in a dataset while retaining the most important information. By reducing the number of variables, we can simplify the problem, improve computational efficiency, and avoid overfitting. Two popular dimensionality reduction techniques are Principal Component Analysis (PCA) and Linear Discriminant Analysis (LDA). Both techniques aim to reduce the dimensionality of the dataset, but they differ in their objectives, assumptions, and outputs. But how do they differ, and when should you use one method over the other? As data scientists, it is important to get a …
Types & Uses of Moments in Statistics
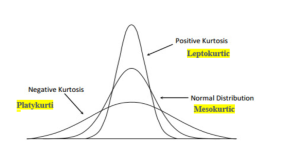
Last updated: 18th Nov, 2023 In statistics, moments are measures of the shape and variability of a data set. They are used to describe the location and dispersion of the data. There are several types of moments that can be calculated, each providing different information about the data set. Let’s take a look at some of these moments, its definitions, formula and examples highlighting how they can be used in statistical analysis. What are Moments in Statistics and what are their types? In statistics, moments are an important tool used to measure the characteristics of a distribution. Moments can provide useful information about the spread, shape, and center of a …
I found it very helpful. However the differences are not too understandable for me