The one-way analysis of variance (ANOVA) test is a statistical procedure commonly used to compare the means values on a specific variable between three or more groups. The significance of the difference between the means of two samples can be judged through either t-test or z-test depending upon different criteria, but it becomes tricky when there is a need to simultaneously evaluate the significance of the difference amongst three or more sample means. This is where one-way ANOVA test comes to rescue. The ANOVA technique enables us to perform this simultaneous test and as such is considered to be an important tool of analysis.
As data scientists, it is of utmost importance to understand the ANOVA test as it is an important statistical tool used in regression models and hypothesis testing. ANOVA test is a useful technique when analyzing data from designed experiments such as comparing the outcome of a clinical trial between control and two or more experimental group. In this blog post, we will discuss the concepts behind the one-way ANOVA test, as well as how to calculate and interpret the results. We will also provide some examples to help illustrate how this test works.
What are ANOVA Tests?
An ANalysis Of VAriance (ANOVA) tests are hypothesis tests that are used to determine whether there is a significant difference between the mean values of some variable in three or more groups. In other words, it can be used to answer the question of whether the average values of variable calculated in three or more populations are equal. One-way ANOVA test is often used in experiments with only one independent variable. In contrast, there are also two-way ANOVA tests, which involve two independent variables or factors. These tests are used when you want to analyze the influence of two categorical independent variables on a continuous dependent variable If there is a need to compare the means of a variable in two populations (independent or pairwise), t-tests can be used.
The F-ratio is a prominent test statistic (also called as F-statistics) used in Analysis of Variance (ANOVA) studies to assess the significance of differences between two or more population means. The F-ratio is calculated by dividing the between-group variance (the variance between groups of data points) by the within-group variance (the variance within each group). Specifically, it is calculated as the ratio of the Mean Square Between (MSB) to the Mean Square Within (MSW). The MSB and MSW are computed by determining the sums of squares for all scores across condition means and within condition means, respectively. An example is explained in the next section.
When analyzing results from an ANOVA, the researcher will compare their obtained F-ratio to critical values taken from tables that provide information on how likely it is that any observed differences were due to chance. The decision to accept or reject the null hypothesis based on an ANOVA study is made using a p-value associated with the calculated F-ratio; if this p-value falls below an established significance level (often set at 0.05), then we can conclude that our null hypothesis should be rejected—that there exists some meaningful difference between at least two groups’ means.
What is one-way ANOVA test?
The one-way ANOVA test is a statistical hypothesis test used to determine the equality of means across several groups. It is the simplest form of ANOVA and involves the comparison of groups based on one variable, known as a factor. This test is necessary when we have more than two groups because t-tests are not suitable in such cases.
Let’s consider an example to understand the need for a one-way ANOVA test. Suppose we want to compare the effectiveness of different drugs in controlling blood sugar levels. We have one variable, blood sugar level, which we want to compare across different drugs. In this scenario, we can use a one-way ANOVA test to assess whether there is a significant difference in the effects of the drugs.
To conduct a one-way ANOVA test, we select one group as a control, which receives standard care, and two or more groups that are given different drugs. The average blood sugar levels are calculated for each group, and then the F-statistic is evaluated to determine the significance of the drug’s effect. If there is a significant difference between the groups, further analysis can be performed to explore the source of this difference.
The one-way ANOVA test is also referred to as a single-factor ANOVA test because it compares the means across different groups based on a single common factor. In our example, the factor is the different drugs administered to the groups. By conducting this test, we can determine whether there are significant differences in the means of the blood sugar levels among the groups receiving different drugs.
Let’s understand the concept of One-way ANOVA test with an example. Let’s say we are evaluating the whether there is a significance difference between the heights of adults in an age group across different countries. If the test would result in significant difference, the cause of difference would then be studied. In the example below, the heights of men across different countries such as US, UK and India is compared. The single factor is country. The following is how the sample data look like with single factor as country. The hypothesis that need to be tested is that there is no significant difference between the mean heights of men above 20 years of age across three different countries such as US, UK and India.
| Country (US) | Country (UK) | Country (India) |
|---|---|---|
| 180 | 185 | 170 |
| 183 | 181 | 183 |
| 172 | 180 | 172 |
| 178 | 179 | 175 |
| 169 | 164 | 164 |
| 179 | 165 | 170 |
| 178 | 180 | 176 |
| 180 | 178 | 167 |
Before delving into the interpretation of the F-statistic and whether it leads to the rejection or acceptance of the null hypothesis, let’s explore some of the formulas involved in the calculation.
The F-statistic, a key component in one-way ANOVA, is defined as the ratio of the mean sum of squares between groups (SSB) to the mean sum of squares within groups (SSW). Its formula can be expressed as:
F = SSB / SSW
Mean sum of squares between the group SSB can be calculated as the following:
SSB = Sum of squares between groups (SSb) / Degrees of freedom between groups (DFb)
Where
DFb = Degree of freedom (between the group) = K – 1 where K is the number of group, and,
Sum of squares between the group (SSB) can be calculated as the following:
SSb = ΣNi(Xi – Xt)² where Xi is mean of group i and Xt is mean of all the observations.
Moving on, the mean sum of squares within the group (MSB) can be calculated as the following:
SSW = Sum of squares within groups (SSW) / Degrees of freedom within groups (DFw)
Where
DFw = degrees of freedom (within group) = N – K where K is the number of group, and N is total number of observations in all the group
Sum of squares within the group (SSW) can be calculated as the following:
SSW = Σ(Xij – Xj)² where Xij is the observation of each group j
SSW can also be written as the following:
SSW = Σ(Ni-1)Std^2
Where Std is standard deviation of each group, N is size of the each group / sample.
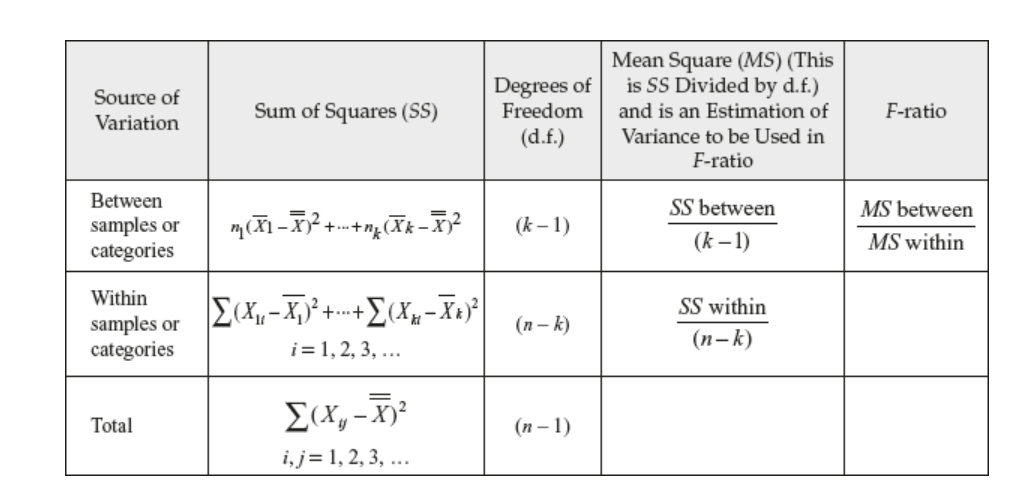
The above information can be put together in what can be called as ANOVA table that looks like the following:

The above formula one-way ANOVA test can also be represented in the following tabular form. k is number of samples and n is total number of items in all the samples.
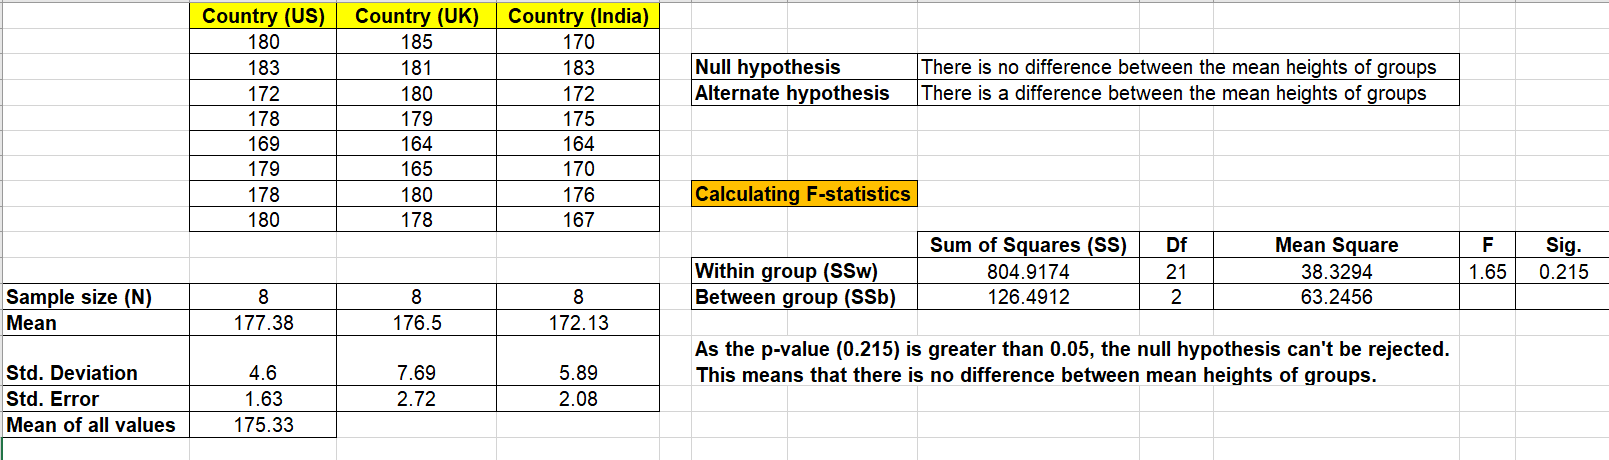
Based on the above formulas, the following calculation is done. The null hypothesis can’t be rejected that there is a difference between the heights across different countries.
Python code for performing one-way ANOVA test
The f_oneway function of scipy.stats can be used to perform one-way ANOVA test for one or more arrays. The method takes the arrays as inputs as shown in the following code and returns the value of f-statistics and p-value. Note that same arrays (heights in US, UK and India) have been used as shown in the spreadsheet above.
import scipy.stats as stats

# Heights data for different countries
heights_us = [180, 183, 172, 178, 169, 179, 178, 180]
heights_uk = [185, 181, 180, 179, 164, 165, 180, 178]
heights_india = [170, 183, 172, 175, 164, 170, 176, 167]

# Perform one-way ANOVA test
f_statistic, p_value = stats.f_oneway(heights_us, heights_uk, heights_india)

# Set significance level (alpha)
alpha = 0.05

# Formulate the null and alternative hypothesis
null_hypothesis = "The means of the height in different countries are equal."
alternative_hypothesis = "The means of the height in different countries are not equal."

# Check if null hypothesis is rejected or not
if p_value < alpha:
    conclusion = "Reject the null hypothesis. There is significant evidence to suggest that the means of the height in different countries are not equal."
else:
    conclusion = "Fail to reject the null hypothesis. There is not enough evidence to suggest that the means of the height in different countries are different."

# Print the results
print("One-Way ANOVA Test Results:")
print("Null Hypothesis:", null_hypothesis)
print("Alternative Hypothesis:", alternative_hypothesis)
print("F-Statistic:", f_statistic)
print("P-value:", p_value)
print("Conclusion:", conclusion)
The following gets printed by executing the above code.
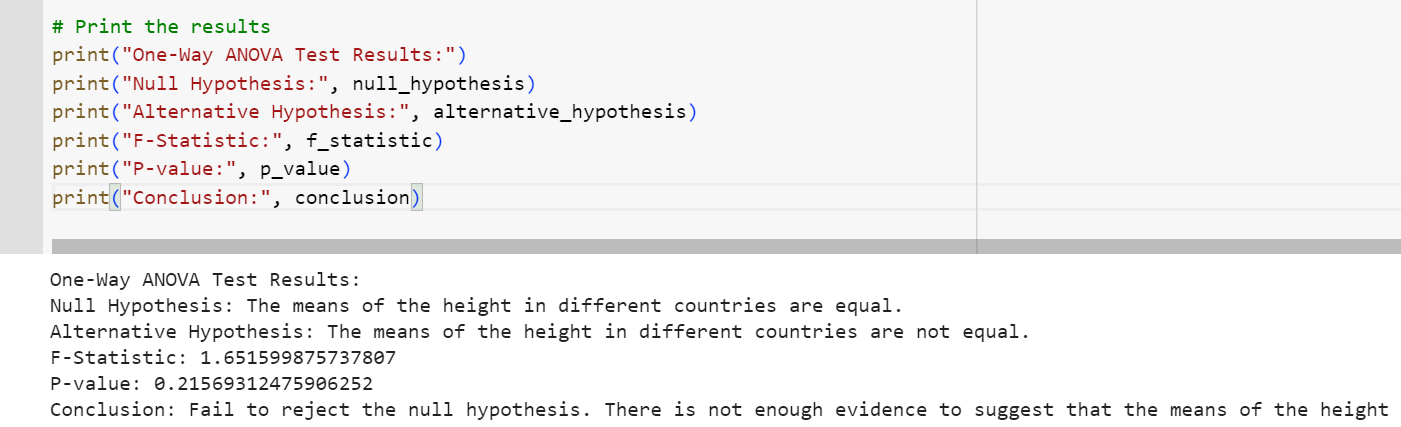
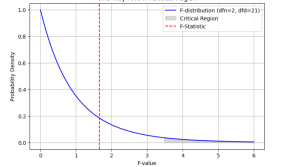
The output of executing above script will be the f-statistics value = 1.651599875737807 and pvalue=0.21569312475906252. This is same as that obtained in excel spreadsheet as shown above. You can see that we don’t have enough evidence to reject the null hypothesis that there is no difference between the heights of samples taken from different countries. The following plot demonstrates the critical region and f-statistics and why we can not reject the null hypothesis.

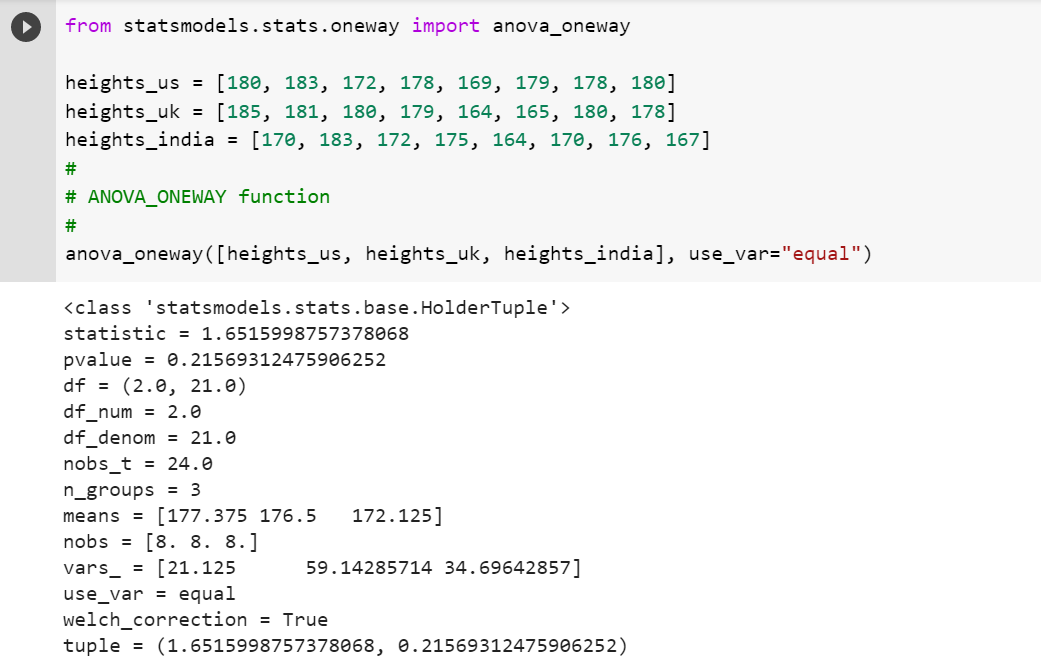
We can also use anova_oneway function of statsmodel.stats.oneway package. The following Python code represents the usage of anova_oneway function.
from statsmodels.stats.oneway import anova_oneway

heights_us = [180, 183, 172, 178, 169, 179, 178, 180]
heights_uk = [185, 181, 180, 179, 164, 165, 180, 178]
heights_india = [170, 183, 172, 175, 164, 170, 176, 167]
#
# ANOVA_ONEWAY function
#
anova_oneway([heights_us, heights_uk, heights_india], use_var="equal")
The following is the output of the execution of above function. Note the value of f-statistics and p-value.
Steps for performing one-way ANOVA test
The following represents the steps of performing one-way ANOVA test with two or more groups:
- Make an assumption to test the equality of population means: The normality assumption and equal variance assumption
- Formulate the null hypothesis that there is no difference between the means of different groups or population
- Formulate the alternate hypothesis that there is a significant difference between the means of two or more groups
- Calculate the sum of squares between the groups (SSB) for each group, and the degrees of freedom (dfb)
- Based on the above, calculate the mean sum of squares between the groups (MSB) as MSB = SSB / dfb
- Calculate the sum of squares within the groups (SSW) for each group, and the degrees of freedom (dfw)
- Based on the above, calculate the mean sum of squares within the groups (MSW) as MSW = SSW / dfw
- Calculate the F-statistics as MSB/MSW
- Use F-table to find the critical value of F at a particular level of significance (such as 0.05) and degrees of freedom as dfb (numerator) and dfw (denominator)
Assumptions for One-Way ANOVA
ANOA test is based on assumptions related to data. If these assumptions are violated, the result of ANOVA test might not be valid. However, it must be noted that ANOVA is a robust statistical procedure which essentially means that even if one of the assumption is violated (such as if the distribution is not Gaussian or assumption related to Homegeneity), it may still product useful result.
- Data appropriateness: The response or outcome variable should be continuous and unbounded.
- Data independence: The value of outcome variable should be independent of each other.
- Data distribution: The value of outcome variable should follow normal or Gaussian distribution within each group.
- Variance homegeneity: The variance of each of the groups should be approximately equal. This can be checked using the statistical procedure such as the Levene statistic.
Real-world examples of One-way ANOVA test
The following represents a few real-world examples where an one-way ANOVA test can be used:
- Evaluation of academic performance of students from different schools
- Assessment of customer satisfaction between two or more products
- Determining difference in quality of service among different branches of a company
- Comparing the average weight of individuals living in different countries or regions.
Summary
The one-way ANOVA test is a statistical hypothesis test that allows us to determine if there is a significant difference between the means of three or more different groups. By calculating the F-statistics, we can test the hypothesis. In order to perform an ANOVA test, we first formulate the null hypothesis to test the equality of population means and then calculate the sum of squares between the groups (SSB) and within the groups (SSW). We then use F-table to find the critical value of F at a particular level of significance. If the critical value of F is greater than the calculated F-statistics, we reject the null hypothesis and conclude that there is a significant difference between the means of different groups. Otherwise, we fail to reject the null hypothesis.

Check out my latest book titled as First Principles Thinking: Building winning products using first principles thinking.
- Three Approaches to Creating AI Agents: Code Examples - June 27, 2025
- What is Embodied AI? Explained with Examples - May 11, 2025
- Retrieval Augmented Generation (RAG) & LLM: Examples - February 15, 2025
Your lecture is very helpful and easy to comprehend. Thanks for this sharing.
I would like to request for other lectures like Kruskal- Wallis, Mann-Whitney etc.
Thank you. Will post them soon and share with you the URL.