Z-score, also known as the standard score or Z-statistics, is a powerful statistical concept that plays a vital role in the world of data science. It provides a standardized method for comparing data points from different distributions, allowing data scientists to better understand and interpret the relative positioning of individual data points within a dataset.
Z-scores represent a statistical technique of measuring the deviation of data from the mean. It is also used with Z-test which is a hypothesis testing statistical technique (one sample Z-test or two samples Z-test). As a data scientist, it is of utmost importance to be well-versed with the z-score formula and its various applications. Having great clarity on the concept of Z-score and/or Z-statistics will help you use the correct formula for calculation in the appropriate cases. In this blog post, we will discuss the concept of Z-score, concepts, formula, and examples.
Z-score / Z-statistics Concepts & Formula
The Z-score formula differs when considering the sample data, or, when considering sampling distributions with an end goal of whether finding the deviation from mean, or, performing hypothesis testing respectively.
- Z-score for sample data: In case of sample data, the objective is to find number of standard deviations an observation is away from the sample mean
- Z-score for sampling distributions: In case of sampling distribution, the goal is to perform Z-test and find the value of Z-score or Z-statistics for hypothesis testing and rejecting the null hypothesis or otherwise. The hypothesis tests where Z-statistics get used is one-sample Z-test and two-samples Z-test.
Additionally, z-score at different confidence intervals can be used to estimate the population mean based on a given sample or difference in the population means based on two different samples.
What is Z-score or Standard Score?
When considering a sample of data, Z-score is used to measure the number of standard deviations by which the data points in the sample differ from the mean. Alternatively, when defined for population, Z-score can be used to measure the number of standard deviations by which the data points differ from the population mean. This is also called as standard score. It is denoted using z and calculated as:
Z = (x-x̄)/σ
where,
x is an observation in the sample
x̄ is the mean of the observations in the sample
σ is the standard deviation of the observations in the sample
Let’s take an example to understand z-score calculation better. Suppose, the mean of data points in a sample is 90 and the standard deviation is 30. The observation X = 45 will have Z-scores as follows:
z= (45 – 90)/30 = [-45]/30 = -1.5
Observation 45 is -1.5 standard deviation away from the mean 90.
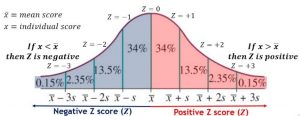
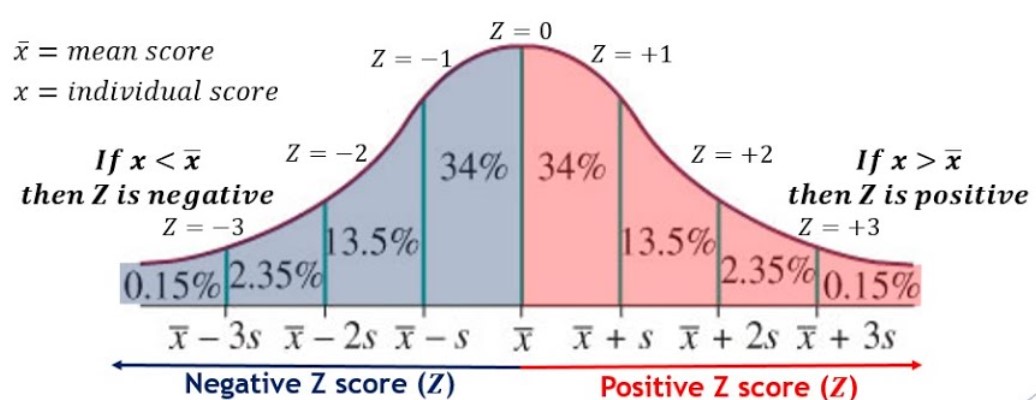
The process of converting raw observations into Z-score is also called as standardization or normalization. When the mean and standard deviation of a data set are known, it is easy to convert them into Z-score for that particular sample or population. The figure below represents different values of Z-scores. Note that Z = +1 represents that the observation is 1 standard deviation away from mean in the positive direction. In the same way, Z=-1 represents that the observation is 1 standard deviation away from mean in the negative direction.
Z-score or Z-statistics for Sampling distribution to perform Z-test
When considering the sampling distribution, Z-score or Z-statistics is defined as the number of standard deviations between the sample mean and the population mean (mean of the sampling distribution). Note that the sampling distribution is used in the hypothesis testing technique known as Z-test. Recall that the sampling distribution is defined as the distribution of all the possible samples that could be drawn from a population. Z-test for sampling distribution is used to determine whether the sample mean is statistically different from the population mean. The value of Z-statistics is used to determine whether to reject the null hypothesis or otherwise. The value of Z-statistics is compared with the critical value of Z-statistics which is determined from the Z-table. If the value of Z-statistics falls in the rejection region, it indicates that there is sufficient evidence to reject the null hypothesis. The formula for z-statistics in Z-test is the following:
Z = (x̄-μ)/SE
where,
x̄ is the sample mean
μ is the mean of the observations in the population
The population mean is denoted by μ and the sample mean is denoted by x̄. SE is standard error (SE) of the sample mean. The standard error of the sample mean can be calculated as the following:
SE = σ/√n
Where standard deviation of the sampling distribution is denoted as σ and the sample size is n.
Let’s take an example to understand z-score calculation better with sampling distribution (which will be used in the hypothesis testing technique known as Z-test). Suppose, a random sample of 100 observations was taken from a population having mean μ = 70 and standard error (SE) of the mean is 15. The mean of the sample is 85. The z-score of the sample mean is calculated as follows:
z = (x̄ -μ)/SE = [(85 – 70)]/15 = 1.0
It means that the sample mean x̄ is 1 standard deviation away from the mean of the sampling distribution.
Z-score or Z-statistics can be used to perform hypothesis testing for the following scenarios:
- Test whether the sample belongs to a population based on the mean (1-sample Z-test for means) and proportion (1-sample Z-test for proportion)
- Test whether two samples taken from different population are different based on mean (2-samples Z-test for mean) and proportion (2-samples Z-test for proportion)
Z-score for Estimating Population Mean/Proportion
The value of Z-score can be used to estimate the population mean / proportion at different confidence intervals as a function of sample mean or proportion. The following formula represents estimating population mean as a function of sample mean and population proportion as a function of sample proportion.
Population mean = sample mean +- MarginOfError
Population proportion = sample proportion +- MarginOfError
MarginOfError can be calculated as the following:
MarginOfError = Z* x StandardError
Standard error can be calculated as the following:
StandardError = StandardDeviationOfSamplingDistribution / SQRT (SampleSize)
Z* represents the value of Z at different confidence interval. For a two-tailed test, the value of Z at 95% interval is +- 1.96.
For 95% confidence interval, the population mean will lie in the following range:
Sample mean +- 1.96*StandardError
Similarly, the population proportion will lie in the following range:
Sample proportion +- 1.96*StandardError
Summary
Z-scores are an essential tool in the world of statistics and data analysis. They can help you measure how far or close your observations (or data points) are from the mean, as well as tell you whether to reject a null hypothesis in case of hypothesis testing. Z-tests for sampling distributions involve calculating z-statistics and comparing it with critical values determined by standard normal distribution or Z-tables. Here are some key points learned in this blog:
- When evaluating a sample data, Z-score represents the number of standard deviations by which the data points in the sample differ from the mean.
- Z-score is also called standard score. The process of converting raw data or observations into Z-score is called standardization or normalization.
- When evaluating the sampling distribution for Z-test, Z-score or Z-statistics is defined as the number of standard deviations that the sample mean is away from the mean of the samplig distribution.
- In Z-test, the Z-statistics is used to determine whether to reject the null hypothesis or otherwise. The value of Z-statistics is compared with the critical value of Z-statistics (at a given level of significance) which is determined from the Z-table. If it falls in the rejection region, then there is enough evidence to reject the null hypothesis.

Check out my latest book titled as First Principles Thinking: Building winning products using first principles thinking.
- Mathematics Topics for Machine Learning Beginners - July 6, 2025
- Questions to Ask When Thinking Like a Product Leader - July 3, 2025
- Three Approaches to Creating AI Agents: Code Examples - June 27, 2025
I found it very helpful. However the differences are not too understandable for me