The Pearson’s Chi-square (χ2) test is a statistical test used to determine whether the distribution of observed data is consistent with the distribution of data expected under a particular hypothesis. The Chi-square test can be used to compare or evaluate the independence of two distributions, or to assess the goodness of fit of a given distribution to observed data. In this blog post, we will discuss different types of Chi-square tests, the concepts behind them, and how to perform them using Python / R. As data scientists, it is important to have a strong understanding of the Chi-square test so that we can use it to make informed decisions about our data. We will also provide some examples so that you can see how they work in practice.
What is Pearson’s Chi-square (χ2) test? What are its uses?
The Pearson’s Chi-square test is a statistical test used to find the truth about the relationship or association or homogenity (independence) between the two categorical variables and whether the variance found in the observation of categorical variable is statistically significant. This is called as chi-square test of independence. For example, the Chi-squared test of independence can be used to test the hypothesis such as whether the presence of diabetes is associated the person getting infected with Covid-19. Another example can be using the Chi-square test of independence for evaluating whether the income of people classified as high / medium / low income is associated with their educational qualification (degree). In other words, the income of people is independent of education qualification of people. The null hypothesis for the Chi-square test of independence is that the categorical variables changes independently. Taking current example in consideration, the null hypothesis will be that the income of people is not related with their education qualification.
In addition to performing hypothesis testing around test of independence, chi-square test can also be used to determine goodness of fit between observed and expected frequencies of categorical variables. This is called as chi-square goodness of fit test.
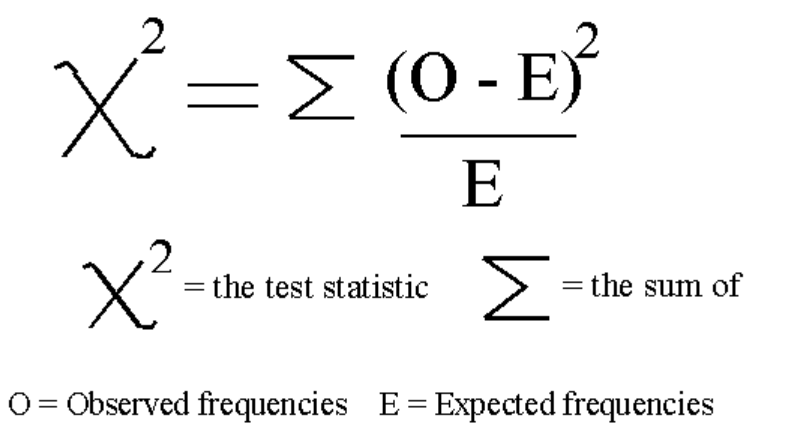
Chi-square test requires calculation of statistics called as chi-square statistic. Chi-square statistics is calculated by taking the sum of the squared differences between the observed and expected values, divided by the expected values.
To perform this chi-square test of independence, we create a contingency table and the calculate chi-square statistics as a function of sum of squared difference between the observed and expected value divided by expected value, for each of the value in the contingency table. If the Chi-square statistic is significant, then the null hypothesis is rejected and the alternative hypothesis is accepted. The alternative hypothesis states that there is an association between two categorical variables.
The Chi-square test of independency requires creation of the contingency table for comparing the categorical variables. A contingency table is a table that shows the frequencies of two categorical variables. The Chi-square test can also be used to compare more than two variables in a multi-way contingency table. In statistics, the most common use of the chi-square statistic is with r x c contingency tables where r represents the row and c represents the column. The contingency table is shown in the example below. r x c contingency table is used to assess whether the null hypothesis of independence among variables is reasonable.
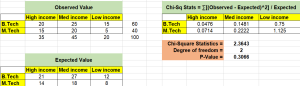
The picture below represents the chi-square test for testing independence between income (high / medium / low) and education level (B.Tech or M.Tech). The null hypothesis states that there is no association between income level and education. Any finding is a chance occurrence. The alternate hypothesis states that there is some association between income level and education level based on the evidence gathered.
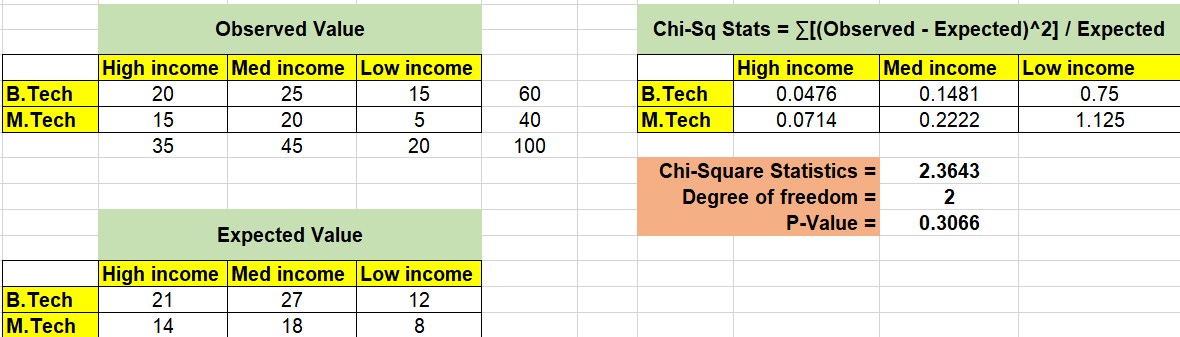
In the above analysis, you could see that p-value comes out to be 0.3066 which is more than the level of significance 0.05. Thus, we don’t have enough evidence to reject the null hypothesis that there is no association between level of income and education level. One can thus say that the categorical variables such as income level and education are independent.
Different types of Chi-square tests, and what do they measure?
Chi-square tests can be used for both Goodness of Fit tests and Independence tests or test of independence.
The Chi-square statistic is used to calculate the p-value for both goodness of fit and test of independence. The p-value is used to determine whether the null hypothesis should be rejected or not. The null hypothesis is rejected if the p-value is less than the alpha level, which is typically 0.05. If the null hypothesis is rejected, then there is a significant difference between the expected and observed distributions. If the null hypothesis is not rejected, then there is not a significant difference between the expected and observed distributions.
The chi-square test is not always accurate, and there are some situations where it should not be used. For example, if any of the expected counts are less than five, or if there is more than 20% missing data, then the chi-square test should not be used. In addition, the chi-square test does not tell us about causation – it only tells us about association. For example, if we find that there is a relationship between gender and political affiliation using the chi-square test, we cannot conclude that one causes the other. We can only conclude that there is an association between gender and political affiliation.
Chi-square goodness of fit test
Goodness of Fit tests are used to determine whether the variance between observed and expected frequencies of occurrence of categorical variables are merely random / accidental or they are statistically significant. For example, do the observed sales figures for different flavors of ice cream fit the expected distribution based on a market survey?
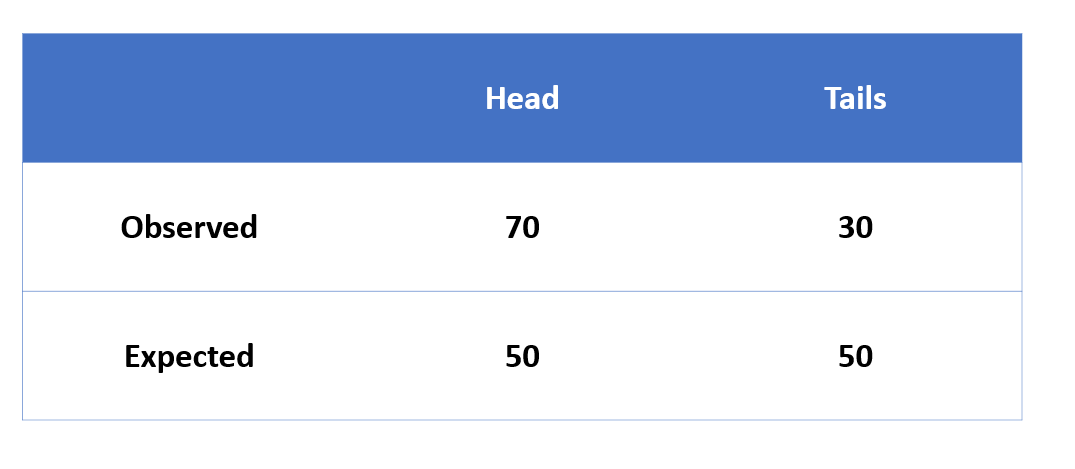
Let’s say we want to test whether the outcomes (head vs tail) of tossing a coin is statistically significant. Here is the contingency table representing the outcomes. The ask is to evaluate whether it can be told with 95% confidence that the outcome has happened merely by chance and is not statistically significant.
Lets formulate the hypothesis:
Null hypothesis, H0: The outcomes of tossing a coin is due to chance / randomness. That is, the number of heads and tails such as 70 & 30 has happened by chance is not statistically significant.
Alternative hypothesis, Ha: The outcomes of tossing a coin is not merely due to chance / randomness and is statistically significant.
The significance level is set as 0.05. The expected value is 50 for heads and 50 for tails when the coin is tossed for 100 times. The observed value is 70 heads and 30 tails. Lets calculate the chi-square statistic.
Chi-square value = (70-50)^2 / 50 + (30-50)^2 / 50
= 400/50 + 400/50
= 800 / 50 = 16
At 0.05 as level of significance and degree of freedom as 1, the critical value is 3.841. The chi-square statistics calculated is 16 which is greater than the critical value of 3.841. Thus, the null hypothesis can be rejected. Thus, it can be said with 95% confidence that the coin is not fair as the outcome is statistically significant.
Let’s say, if the no. of head would have come to 58 and tails to be 42, the chi-square statistics would come out to be 2.56 which is less than the critical value 3.841. Thus, the null hypothesis can’t be rejected. This outcome could have happened by chance.
Chi-square statistics are calculated in Python using the scipy.stats.chisquare() function. This function takes two arguments: an array of observed values and an array of expected values. The chi-square statistic is calculated by subtracting the expected values from the actual values, squaring the result, and dividing by the expected values. The resulting value is then compared to a critical value to determine whether or not the difference is statistically significant.
The example of tossing the coin 100 times and getting the outcome as 70H and 30T as shown in previous section can be tackled using Python in the following manner. The chi-square value can be calculated as the following:
from scipy.stats import chisquare
chisquare([70, 30], f_exp=[50, 50])
The output from above is the following:
Power_divergenceResult(statistic=16.0, pvalue=6.334248366623988e-05)
Given that the p-value is less than 0.05, the null hypothesis can be rejected.
Chi-square test of independence
The chi-square test of independence is a statistical test used to determine whether two variables are independent of each other. The test is used when the variables are categorical and the data are arranged in a contingency table. The chi-square test statistic is calculated by comparing the observed frequencies in the contingency table to the expected frequencies, based on the assumption of independence. If the two variables are independent, then the chi-square statistic will be small. If there is a significant association between the two variables, then the chi-square statistic will be large.
Lets understand with example of whether the persons suffering from diabetes have a higher risk of getting infected with COVID-19. To assess the risk of COVID-19 for people with diabetes, we can perform a statistical test to compare the outcomes of COVID-19 patients with and without diabetes.
Here are the steps:
- Data Filtering: Filter the data to include only rows where the test result is positive or negative, and where the diabetes status is known.
- Contingency Table: Create a contingency table to show the frequencies of test results for people with and without diabetes. We can use Pandas crosstab function to work on Pandas Dataframe consisting of whether person has diabetes as one column and whether person suffered from COVID-19 as another column.
contingency_table = pd.crosstab(index=df[‘DIABETES’], columns=df[‘RESULT’])
contingency_table.rename(index={1: ‘Has Diabetes’, 2: ‘No Diabetes’}, columns={1: ‘Positive Test’, 2: ‘Negative Test’}, inplace=True)
contingency_table
The following contingency table can get printed. I have worked with a sample data to arrive at the below numbers.

- Statistical Test: Perform a Chi-squared test of independence to assess whether having diabetes is statistically associated with the COVID-19 test result. The following Python code can be used to determine chi-square statistics and p-value.
from scipy.stats import chi2_contingency

# Step 3: Perform Chi-squared test
chi2, p_value, dof, expected = chi2_contingency(contingency_table)

chi2, p_valu
The Chi-squared statistic is approximately 2929.05 and the p-value is 0.0. The p-value is less than the commonly used significance level of 0.05, which means we reject the null hypothesis H0. This suggests that having diabetes is not independent of the COVID-19 test result, implying that people with diabetes could be at a different risk level compared to those without diabetes. However, statistical significance does not necessarily mean practical significance. To understand how strong this association is, we should calculate the effect size. The following Python code can be used:
import numpy as np

# Step 4: Calculate Effect Size (Phi coefficient)
N = np.sum(contingency_table.values)  # Total number of observations
phi_coefficient = np.sqrt(chi2 / N)

phi_coefficient
The Phi coefficient is approximately 0.106. The Phi coefficient ranges from 0 to 1, where 0 means no association and 1 means a perfect association. A value of 0.1060.106 suggests a small to moderate effect size, indicating that while there is a statistically significant association between having diabetes and COVID-19 test results, the practical significance of this relationship is relatively modest.
Some examples of how to use the Chi-square test in practice
The following are some real-world examples of Chi-square test in use.
- In a study of 1000 students done in 2020, 575 were female and 425 were male. The study done in 2022 found 585 as female and 415 as male. Is the variation statistically significant?
- A company may want to determine if there is a relationship between the type of product purchased and the customer’s location. Chi-square test of independence can be used.
- Another example might be a study showing whether there is an association between income level and educational qualification.
- Another example of chi-square test of independence can be analyzing the correlation between gender and academic performance. Another example can be investigating whether eating breakfast affects student grades in school. Yet another example can be examining if education level is related to voting behavior.
That’s it for our introduction to the Chi-square (χ2) test. We hope this article has given you a better understanding of what this powerful tool can do, and how to use it. If you have any questions or would like more information, please don’t hesitate to reach out to us. We’re always happy to help!

Check out my latest book titled as First Principles Thinking: Building winning products using first principles thinking.
- Three Approaches to Creating AI Agents: Code Examples - June 27, 2025
- What is Embodied AI? Explained with Examples - May 11, 2025
- Retrieval Augmented Generation (RAG) & LLM: Examples - February 15, 2025
I found it very helpful. However the differences are not too understandable for me