
A lot of beginners in the field of data science / machine learning are intimidated by the prospect of doing data analysis and building regression (linear) & classification models in Python. But with an ability to create sample dataset using Python packages, you can practice your skills and build your confidence over a period of time. The technique demonstrated in this blog post to create and visualize / plot the sample dataset includes datasets that can be used for regression models such as linear regression and classification models such as logistic regression, random forest, SVM etc. You can use this technique to explore different methods for solving the same problem.
Sample Dataset for Regression
When it comes to linear regression, there are two key things that you need in order to train a model: (1) a set of data points that represent the relationship between the input and output variables, and (2) a model that can learn from this data. In this section, we will learn about how to create the sample dataset for linear regression. In Python, you can create a sample dataset for linear regression by using the make_regression method of Sklearn.datasets module. We will also plot the points for understanding & visualization purpose.
The make_regression method of Sklearn.datasets module can be used to create a sample dataset for linear regression. The input to this method is the number of features and the number of samples. It will create a dataframe with n_samples rows and n_features columns, where each row corresponds to a data point and each column corresponds to an input feature. We can plot the points generated by make_regression method by using the plt.scatter() function in matplotlib library. The following code related make_regression method will do this:
# For Visualization
import matplotlib.pyplot as plt
%matplotlib inline

# For creating dummy datasets using sklearn
from sklearn.datasets import make_regression

x,y = make_regression(n_samples=100, n_features=5, noise=50, random_state=42)
plt.scatter(x[:, 0],y)
plt.show()
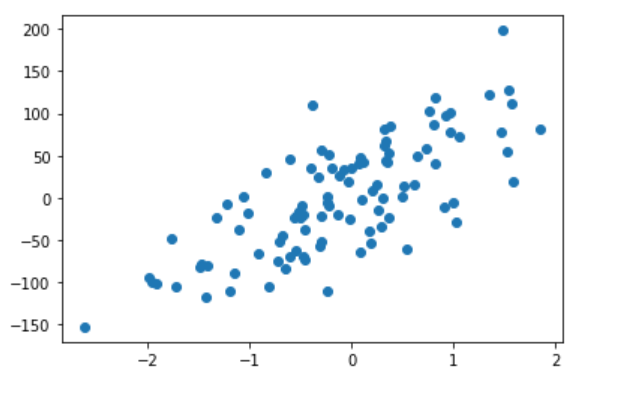
As we can see from the scatterplot, there seems to be a linear relationship between the input features and the output variable. This is what we would expect from a linear regression model.
Sample Dataset for Classification
Sample datasets are important for two reasons. First, they allow you to test your algorithms and methods on data that is representative of the problem you are trying to solve. Second, they help you to understand the behavior of your algorithms and to identify potential issues. In the context of classification, sample datasets can be used to train and evaluate classifiers apart from having a good understanding of how different algorithms work. The make_classification() function of the sklearn.datasets module can be used to create a sample dataset for classification. This function takes several arguments some of which are following:
- n_samples: No. of samples to be created
- n_features: No. of features to be included in each sample
- n_classes: No. of classes; If not assigned, the default is 2
- n_informative: No. of informative features
- n_redundant: No. of redundant features
- n_clusters_per_class: No. of clusters per classes
We can plot the points generated by make_classification method by using the plt.scatter() function in matplotlib library. The following code related make_classification method will do this:
# For Visualization
import matplotlib.pyplot as plt
%matplotlib inline

# For creating dummy datasets using sklearn
from sklearn.datasets import make_classification

x,y = make_classification(n_samples=100, n_features=5, n_redundant=1, n_informative=2, n_clusters_per_class=1, random_state=42)
plt.scatter(x[:, 0], x[:, 1], marker="o", c=y, s=25, edgecolor="k")
plt.show()

Conclusion
Creating a sample dataset for regression & classification in Python can be helpful in understanding the behavior of different algorithms and building confidence over time. The make_regression() and make_classification() methods of the Sklearn.datasets module can be used to create a sample dataset for regression and classification, respectively. These methods take several arguments which can be customized according to your needs. You can also plot the points generated by these methods using the plt.scatter() function in matplotlib library. Hope you found this article helpful. Happy Learning!

Check out my latest book titled as First Principles Thinking: Building winning products using first principles thinking.
- Mathematics Topics for Machine Learning Beginners - July 6, 2025
- Questions to Ask When Thinking Like a Product Leader - July 3, 2025
- Three Approaches to Creating AI Agents: Code Examples - June 27, 2025
I found it very helpful. However the differences are not too understandable for me