In this post, you will learn about the concepts of what is Softmax regression/function with Python code examples and why do we need them? As data scientist/machine learning enthusiasts, it is very important to understand the concepts of Softmax regression as it helps in understanding the algorithms such as neural networks, multinomial logistic regression, etc in a better manner. Note that the Softmax function is used in various multiclass classification machine learning algorithms such as multinomial logistic regression (thus, also called softmax regression), neural networks, etc.
Before getting into the concepts of softmax regression, let’s understand what is softmax function.
What’s Softmax function?
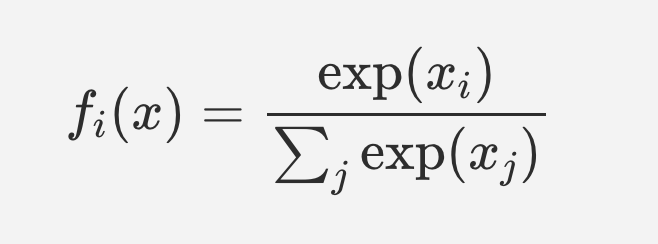
Simply speaking, the Softmax function converts raw values (as an outcome of functions) into probabilities. The softmax function was invented in 1959 by the social scientist R. Duncan Luce in the context of choice models. Here is what the softmax function looks like:

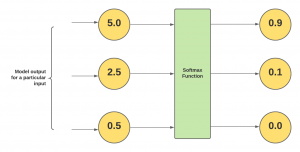
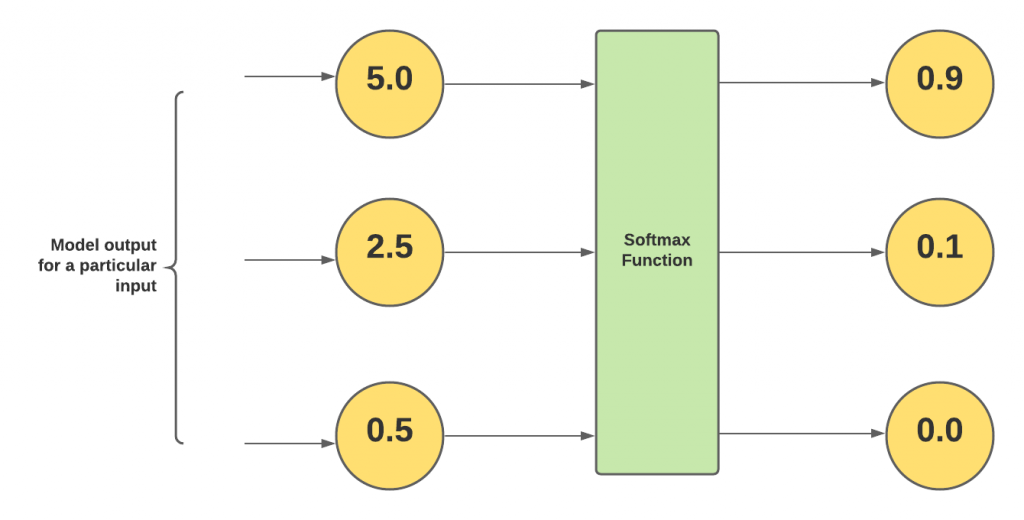
Let’s understand this with an example. Let’s say the models (such as those trained using algorithms such as multi-class LDA, and multinomial logistic regression) output three different values such as 5.0, 2.5, and 0.5 for a particular input. In order to convert these numbers into probabilities, these numbers are fed into the softmax function as shown in fig 1.

Notice that the softmax outputs are less than 1. And, the outputs of the softmax function sum up to 1. Owing to this property, the Softmax function is considered an activation function in neural networks and algorithms such as multinomial logistic regression. Note that for binary logistic regression, the activation function used is the sigmoid function.
Based on the above, it could be understood that the output of the softmax function maps to a [0, 1] range. And, it maps outputs in a way that the total sum of all the output values is 1. Thus, it could be said that the output of the softmax function is a probability distribution.
Here is the Python code which was used to derive the value shown in fig 2.
import numpy as np
#
# Input to softmax function
#
input_to_softmax = [5.0, 2.5, 0.5]
#
# Denominator of softmax function
# Summation of exponentials
#
exp_sum = np.exp(input_to_softmax[0]) \
                + np.exp(input_to_softmax[1]) \
                + np.exp(input_to_softmax[2])
#
# Softmax functon outputs
#
softmax_outputs = [round(np.exp(input_to_softmax[0])/exp_sum, 1),
                   round(np.exp(input_to_softmax[1])/exp_sum, 1),
                   round(np.exp(input_to_softmax[2])/exp_sum, 1)]
#
# Print the softmax function output
#
softmax_outputs
When written in a concise manner, the softmax function output for input [5.0, 2.5, 0.5] can also be obtained using the following Python code. The out is [0.9, 0.1, 0.0] as shown in the above diagram.
import numpy as np
#
# Input to softmax function
#
input_to_softmax = [5.0, 2.5, 0.5]
#
# Softmax outputs
#
softmax_outputs = np.exp(input_to_softmax) / np.sum(np.exp(input_to_softmax))
#
#
[round(output, 1) for output in softmax_outputs]
Why is Softmax Function needed?
The softmax function is used in classification algorithms where there is a need to obtain probability or probability distribution as the output. Some of these algorithms are the following:
- Neural networks
- Multinomial logistic regression (Softmax regression)
- Bayes naive classifier
- Multi-class linear discriminant analysis
In artificial neural networks, the softmax function is used in the final/last layer.
The softmax function is also used in the case of reinforcement learning to output probabilities related to different actions to be taken.
What is Softmax Regression?
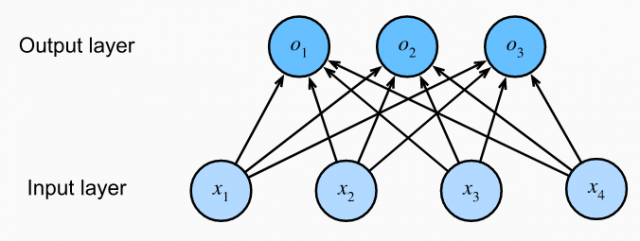
Softmax regression (also known as softmax classifier) is a generalization of logistic regression to the case where we want to handle multiple classes. In logistic regression, we were predicting the probability that an instance belonged to one and only one class. This could be extended to multiple classes by considering a separate logistic regression model for each class like the ones shown below. The equations shown below compute the logits o1, o2, and o3. Recall that logit is nothing but the log of odds of success of an event.
The above functions can also be represented as a fully-connected single-layer neural network where the single layer consists of three computation units such as those shown below:
But the above approach can be inefficient because it generally requires a lot of duplicated effort. Softmax regression address this issue by using the softmax function to compute a probability for each class, based on the values of the input features. As shown in the first section, the softmax function is defined as follows:
softmax(x) = exp(x) / sum(exp(x))
The output of the softmax regression is considered as the probabilities such as y1, y2, y3, etc belonging to classes 1, 2, 3, etc. The approach that is taken with softmax regression (softmax classifier) is that the different outputs of the function such as y1, y2, y3, etc are interpreted as the probability that the input item belongs to class 1, class 2, class 3, etc. The class with the largest probability (output value) is chosen as the prediction of the softmax regression model.
The output values or probabilities such as y1, y2, and y3 can be calculated by using the softmax function with the logits output value o1, o2, and o3 as shown in the function below.
The output probability sums up to 1. Thus, y1 + y2 + y3 = 1. [latex]y_hat[/latex] can be called a probability distribution.
For example, for a given input item, if the output value for different classes y1, y2, and y3 comes out to be 0.1, 0.2, and 0.7 respectively, the input item is predicted to be belonging to class 3 with the highest probability value.
The softmax function is a non-linear function. However, the softmax regression is a linear model as the outputs of softmax regression are determined as a summation of input features and weights.
Softmax Regression Real-World Example
A real-world example where softmax regression can be used is image classification. You can use MNIST data or Fashion-MNIST data which is more complex than the MNIST data. The Fashion-MNIST, as shown below, consists of images from 10 categories, each represented by 6000 images in the training dataset and by 1000 in the test dataset. Consequently, the training set and the test set contain 60000 and 10000 images, respectively. The images in Fashion-MNIST can be bucketed into the following categories as shown below: trousers, t-shirt, dress, pullover, sandal, coat, sneaker, bag, ankle boot, and shirt.
When softmax regression is applied for training the model to classify the images in one of the ten categories, there are 10 outputs pertaining to 10 classes. When trained using a neural network, the network will have the output in 10 dimensions. Softmax regression can be used for multiclass classification problem such as this.
The following will be steps followed for training the model using neural network and making predictions using softmax regression:
- The fashion-MNIST data should be loaded and split in training and test data set.
- The output layer is a fully connected layer with 10 outputs owing to softmax regression
- For every input image fed into the neural network, there will be 10 outputs representing the probability that the input image belongs to each of the 10 classes. This outputs get calculated based on softmax function.
Conclusion
Here is the summary of what you learned about the softmax function, softmax regression and why do we need to use it:
- The softmax function is used to convert the numerical output to values in the range [0, 1]
- The output of the softmax function can be seen as a probability distribution given the output sums up to 1
- The softmax function is used in multiclass classification methods such as neural networks, multinomial logistic regression, multiclass LDA, and Naive Bayes classifiers.
- The softmax function is used to output action probabilities in case of reinforcement learning
- The softmax function is used as an activation function in the last/final layer of the neural network algorithm.
- Mathematics Topics for Machine Learning Beginners - July 6, 2025
- Questions to Ask When Thinking Like a Product Leader - July 3, 2025
- Three Approaches to Creating AI Agents: Code Examples - June 27, 2025


I found it very helpful. However the differences are not too understandable for me