In the field of data science, it’s important to have a strong understanding of statistics and know the difference between related concepts. This is especially true when it comes to the concepts of covariance, correlation, and variance. Whether you’re a data scientist, statistician, or simply someone who wants to better understand the relationships between different variables, it’s important to know the difference between covariance, correlation, and variance. While these concepts may seem similar at first glance, they each have unique applications and serve different purposes. In this blog post, we’ll explore each of these concepts in more detail and provide concrete examples of how to calculate them using Python.
What is Covariance? How does it work?
Covariance measures how two variables change in relation to each other. In other words, it measures whether the variables increase or decrease together. If the variables tend to increase or decrease together, the covariance is positive. If one variable increases as the other decreases, then the covariance is negative.
The formula for calculating covariance for a sample of data is as follows. The numerator in this formula is called the “covariance”, while the denominator is called the “degrees of freedom”. The numerator gives us a measure of how much X and Y vary together, while the denominator tells us how many data points we have to work with.
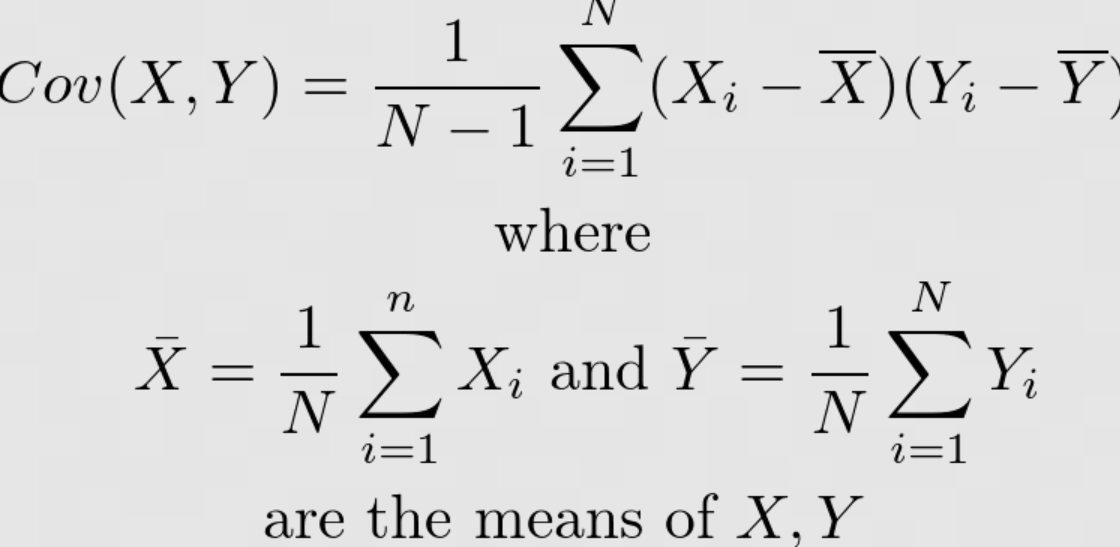
where X and Y are the two random variables and N is the number of observations. Here is the formula for calculating the covariance for the population data.

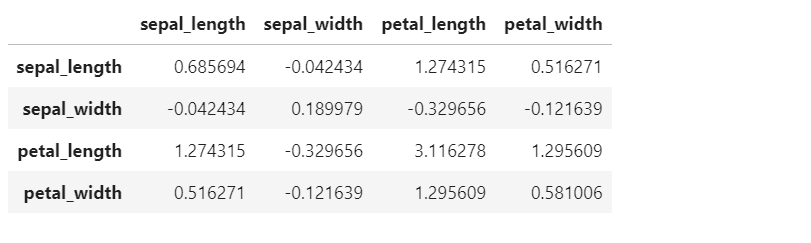
The following represents the Python code for calculating the pairwise covariance of different columns of IRIS dataset. Note that IRIS dataset is loaded and a Pandas dataframe is created. Then, method cov() is invoked on the Pandas dataframe to calculate covariance.
import pandas as pd
from sklearn import datasets
#
# Load IRIS dataset
#
iris = datasets.load_iris()
#
# Create dataframe from IRIS dataset
#
df = pd.DataFrame(iris.data, columns=["sepal_length", "sepal_width", "petal_length", "petal_width"])
df["class"] = iris.target
#
# Calculate covariance between different columns
#
df.iloc[:, 0:4].cov()
What is Correlation? How does it work?
Correlation is similar to covariance in that it measures how two variables change in relation to each other. However, correlation normalizes the variance of both variables, which makes it easier to interpret than covariance. Correlation can range from -1 to 1; a value of 0 indicates that there is no linear relationship between the two variables, a value of 1 indicates that there is a perfect positive linear relationship (i.e., as one variable increases, so does the other), and a value of -1 indicates that there is a perfect negative linear relationship (i.e., as one variable increases, the other decreases).
The formula for calculating correlation as a function of covariance and standard deviation goes as following:
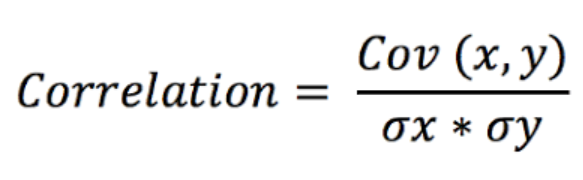
where cov(X,Y) is the covariance between X and Y , σ_X is the standard deviation of X , and σ_Y is the standard deviation of Y.
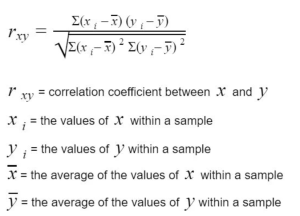
Correlation formula can also be represented as the following:

The following represents the Python code for calculating the pairwise correlation of different columns of IRIS dataset. Note that IRIS dataset is loaded and a Pandas dataframe is created. Then, method corr() is invoked on the Pandas dataframe to calculate covariance.
import pandas as pd
from sklearn import datasets
#
# Load IRIS dataset
#
iris = datasets.load_iris()
#
# Create dataframe from IRIS dataset
#
df = pd.DataFrame(iris.data, columns=["sepal_length", "sepal_width", "petal_length", "petal_width"])
df["class"] = iris.target
#
# Calculate pairwise correlation between different columns
#
df.iloc[:, 0:4].corr()

What is Variance? How does it work?
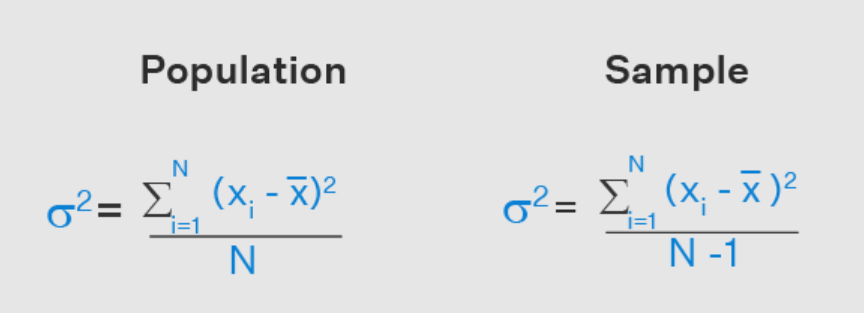
Variance measures how much the value of the random variable varies from its mean. A high variance indicates that the data points are spread out; a low variance indicates that they are close to the mean. The formula for calculating variance for the population and the sample data is as following. Again, the numerator is called the “variance” and the denominator is called the “degrees of freedom”. The numerator gives us a measure of how much X varies, while the denominator tells us how many data points we have to work with.
The var() method can be invoked on Pandas dataframe to calculate variance of different columns. The code below represents the same.
import pandas as pd
from sklearn import datasets
#
# Load IRIS dataset
#
iris = datasets.load_iris()
#
# Create dataframe from IRIS dataset
#
df = pd.DataFrame(iris.data, columns=["sepal_length", "sepal_width", "petal_length", "petal_width"])
df["class"] = iris.target
#
# Calculate variance for different columns
#
df.iloc[:, 0:4].var()

When to use Covariance, Variance & Correlation?
All three measures are important in statistics and data analysis, and each has its own advantages and disadvantages. Covariance and variance are both measures of variability. Covariance is a measure of how two variables vary together, while variance is a measure of how a single variable varies. Correlation is a measure of the strength of the relationship between two variables. Covariance and correlation are always defined between two variables, while variance is defined for a single variable. For example, if we were looking at the height and weight of a group of people, we could calculate the covariance to see how those two variables vary together. If we were interested in just height or just weight, we would calculate the variance. And if we wanted to know how strongly height and weight are related, we would calculate the correlation.
Conclusion
As you can see from the examples above, covariance, correlation, and variance all differ slightly in their calculation and interpretation. However, all three measures can be useful in understanding the relationships between different variables. Which measure you use will depend on your specific goals and objectives. Regardless of which measure you choose, understanding how to calculate them using Python will give you a valuable tool in your data analysis arsenal.

Check out my latest book titled as First Principles Thinking: Building winning products using first principles thinking.
- Mathematics Topics for Machine Learning Beginners - July 6, 2025
- Questions to Ask When Thinking Like a Product Leader - July 3, 2025
- Three Approaches to Creating AI Agents: Code Examples - June 27, 2025
I found it very helpful. However the differences are not too understandable for me