Tag Archives: Data Science
Python – Replace Missing Values with Mean, Median & Mode
Last updated: 18th Dec, 2023 Have you found yourself asking question such as how to deal with missing values in data analysis stage? When working with Python, have you been troubled with question such as how to replace missing values in Pandas data frame? Well, missing values are common in dealing with real-world problems when the data is aggregated over long time stretches from disparate sources, and reliable machine learning modeling demands for careful handling of missing data. One strategy is imputing the missing values, and a wide variety of algorithms exist spanning simple interpolation (mean, median, mode), matrix factorization methods like SVD, statistical models like Kalman filters, and deep …
Standard Deviation of Population vs Sample
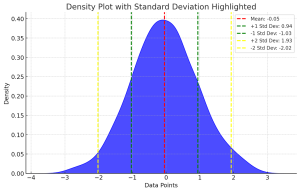
Last updated: 18th Dec, 2023 Have you ever wondered what the difference between standard deviation of population and a sample? Or why and when it’s important to measure the standard deviation of both? In this blog post, we will explore what standard deviation is, the differences between the standard deviation of population and samples, and how to calculate their values using their formula and Python code example. By the end of this post, you should have a better understanding of standard deviation in general and why it’s important to calculate it for both populations and samples. Check out my related post – coefficient of variation vs standard deviation. What is …
Tool – Machine Learning Algorithm Cheat Sheet

Here is a comprehensive and user-friendly tool designed to bridge the gap between complex machine learning concepts and practical understanding. Whether you’re a student, educator, data scientist, or just a curious learner, this tool is your go-to resource for quick insights into some of the most popular and widely used machine learning algorithms. From Linear Regression to more advanced techniques like XGBoost and Principal Component Analysis, the plugin offers a succinct summary of each algorithm, including its definition, typical use cases, and applicable Python and R libraries. Select a Machine Learning Algorithm Select a machine learning algorithm from the drop-down to view and learn the details. Select a Feature Scaling …
One-Sample T-Test Calculator

Here are two different methods of calculating t-statistics for one-sample t-test. In method 1, you enter the dataset. In method 2, you provide the sample mean, sample standard deviation and sample size. Here are the common set of inputs. One of the input field is the hypothesized mean, which is the population mean you expect or hypothesizes before conducting the test. This value is crucial for comparison against the sample mean. By default, it is set to 0, but you can modify it based on their hypothesis. The significance level, another critical input, is pre-set at 0.05 but can be adjusted. This level determines the threshold for statistical significance. In …
One Sample T-test: Formula & Examples
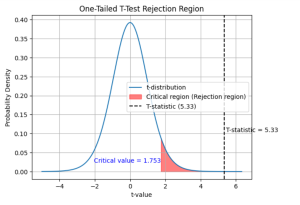
Last updated: 16th Dec, 2023 In statistics, the t-test is often used in research when the researcher wants to know if there is a significant difference between the mean of sample and the population, or whether there is a significant difference between the means of two groups (unpaired / independent or paired). There are three types of t-tests: the one sample t-test, two samples or independent samples t-test, and paired samples t-test. In this blog post, we will focus on the one sample t-test and explain with formula and examples. As data scientists, it is important for us to understand the concepts of t-test and how to use it in …
Linear Regression vs. Polynomial Regression: Python Examples
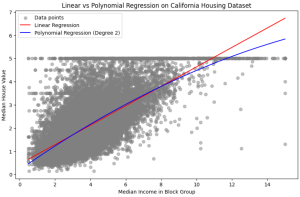
In the realm of predictive modeling and data science, regression analysis stands as a cornerstone technique. It’s essential for understanding relationships in data, forecasting trends, and making informed decisions. This guide delves into the nuances of Linear Regression and Polynomial Regression, two fundamental approaches, highlighting their practical applications with Python examples. What are Linear and Polynomial Regression? In this section, we will learn about what are linear and polynomial regression. What is Linear Regression? Linear Regression is a statistical method used in predictive analysis. It’s a straightforward approach for modeling the relationship between a dependent variable (often denoted as y) and one or more independent variables (denoted as x). In …
Linear Regression vs Logistic Regression: Python Examples
Last updated: 15th Dec, 2023 In the ever-evolving landscape of machine learning, two regression algorithms stand out for their simplicity and effectiveness: Linear Regression and Logistic Regression. But what exactly are these algorithms, and how do they differ from each other? At first glance, logistic regression and linear regression might seem very similar – after all, they share the word “regression.” However, the devil, as they say, is in the details. Each method is uniquely tailored to solve specific types of problems, and understanding these subtleties is key to unlocking their full potential. Linear regression and logistic regression are both machine learning algorithms used for modeling relationships between variables but …
Linear Regression in Machine Learning: Python Examples
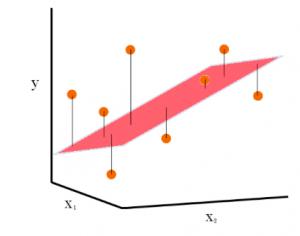
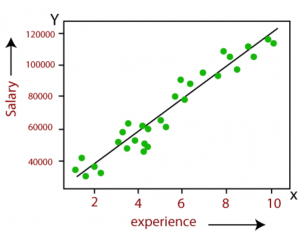
Last updated: 15th Dec, 2023 In this post, the linear regression concepts in machine learning is explained with multiple real-life examples. Two types of regression models (simple/univariate and multiple/multivariate linear regression) are taken up for sighting examples. In addition, Python code examples are used for demonstrating training of simple linear and multiple linear regression models. In case you are a machine learning or data science beginner, you may find this post helpful enough. You may also want to check a detailed post – What is Machine Learning? Concepts & Examples. What is Linear Regression? Linear regression is a machine learning concept that is used to build or train the models …
Random Forest vs XGBoost: Which One to Use? Examples

Understanding the differences between XGBoost and Random Forest machine learning algorithm is crucial as it guides the selection of the most appropriate model for a given problem. Random Forest, with its simplicity and parallel computation, is ideal for quick model development and when dealing with large datasets, whereas XGBoost, with its sequential tree building and regularization, excels in achieving higher accuracy, especially in scenarios where overfitting is a concern. This knowledge can be helpful to balance between computational efficiency and predictive performance, tailor models to specific data characteristics, and optimize their approach for either rapid prototyping or precision-focused tasks. In this blog, we will learn the difference between Random Forest …
How to Add Rows & Columns to Pandas Dataframe
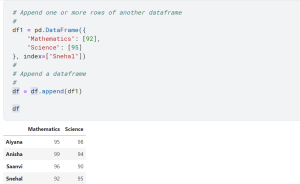
Last updated: 12th Dec, 2023 Pandas is a popular data manipulation library in Python, widely used for data analysis and data science tasks. Pandas Dataframe is a two-dimensional labeled data structure with columns of potentially different types, similar to a spreadsheet or SQL table. One of the common tasks in data manipulation when working with Pandas package in Python is how to add new columns and rows to an existing and empty dataframe. It might seem like a trivial task, but choosing the right method to add a row to a dataframe as well as adding a column can significantly impact the performance and efficiency of your code. In this …
Difference Between Decision Tree and Random Forest
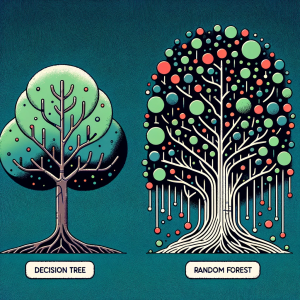
Last updated: 11th Dec, 2023 In machine learning, there are a few different tree-based algorithms that can be used for both regression and classification tasks. Two of the most popular are decision trees and random forest. A decision tree is a basic machine learning model, resembling a flowchart. Random Forest, an advanced technique, combines multiple decision trees to enhance accuracy and reduce overfitting, using averaging or voting for final predictions. Essentially, Random Forest is a collection of decision trees working together. Both of these algorithms have their similarities and differences, and in this blog post, we’ll take a look at the key differences between them. What’s Decision Tree Algorithm? How …
F-test & F-statistics in Linear Regression: Formula, Examples
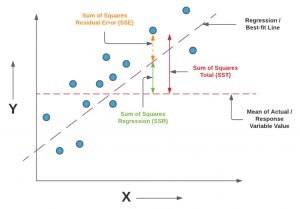
Last updated: 11th Dec, 2023 In this blog post, we will take a look at the concepts and formula of f-test and related f-statistics in linear regression models and understand how to perform f-test and interpret f-statistics in linear regression with the help of examples. F-test and related F-statistics interpretation is key if you want to assess if the linear regression model results in a statistically significant fit to the data overall. An insignificant F-test determined by the f-statistics value vis-a-vis critical region implies that the predictors have no linear relationship with the target variable. We will start by discussing the importance of F-test and f-statistics in linear regression models …
Plot Decision Boundary in Logistic Regression: Python Example
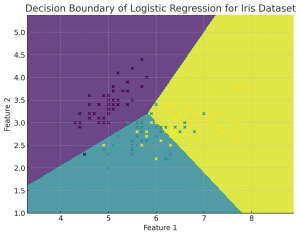
Plotting the decision boundary is a valuable tool for understanding, debugging, and improving machine learning classification models, especially for Logistic Regression. Plotting the decision boundary provides a visual assessment of model complexity, fit, and class separation capability. It enables identifying overfitting and underfitting based on gaps between boundary and data. Comparing decision boundary plots of different models allows direct visual evaluation of their relative performance in separating classes when working with classification problems. For linear models like logistic regression, it specifically helps tune regularization and model complexity to prevent overfitting the training data. Simple linear models like logistic regression will have linear decision boundaries. More complex models like SVM may …
Forecasting using Linear Regression: Python Example

Linear regression is a simple and widely used statistical method for modeling relationships between variables. While it can be applied to time-series data for trend analysis and basic forecasting, it is not always the most apt method for time-series forecasting due to several limitations. Forecasting using Linear Regression Forecasting using linear regression involves using historical data to predict future values based on the assumption of a linear relationship between the independent variable (time) and the dependent variable (the metric to be forecasted, like CO2 levels discussed in next section). The process typically involves the following steps: Limitations for Linear Regression used in Forecasting Is linear regression most efficient method for …
Gradient Boosting vs Adaboost Algorithm: Python Example

In this blog post we will delve into the intricacies of two powerful ensemble learning techniques: Gradient Boosting and Adaboost. Both methods are widely recognized for their ability to improve prediction accuracy in machine learning tasks, but they approach the problem in distinct ways. Gradient Boosting is a sophisticated machine learning approach that constructs models in a series, each new model specifically targeting the errors of its predecessor. This technique employs the gradient descent algorithm for error minimization and excels in managing diverse datasets, particularly those with non-linear patterns. Conversely, Adaboost (Adaptive Boosting) is a distinct ensemble strategy that amalgamates numerous simple models to form a robust one. Its defining …
Feature Importance & Random Forest – Sklearn Python Example
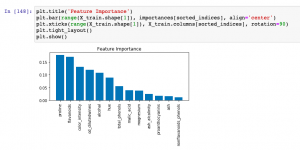
Last updated: 9th Dec, 2023 When building machine learning classification and regression models, understanding which features most significantly impact your model’s predictions can be as crucial as the predictions themselves. This post delves into the concept of feature importance in the context of one of the most popular algorithms available – the Random Forest. Whether used for classification or regression tasks, Random Forest not only offers robust and accurate predictions but also provides insightful metrics to find the most important features in your dataset. You will learn about how to use Random Forest regression and classification algorithms for determining feature importance using Sklearn Python code example. It is very important to …
I found it very helpful. However the differences are not too understandable for me