Tag Archives: Data Science
Amazon (AWS) Machine Learning / AI Services List

Last updated: 30th Jan, 2024 Amazon Web Services (AWS) is a cloud computing platform that offers machine learning as one of its many services. AWS has been around for over 10 years and has helped data scientists leverage the Amazon AWS cloud to train machine learning models. AWS provides an easy-to-use interface that helps data scientists build, test, and deploy their machine learning models with ease. AWS also provides access to pre-trained machine learning models so you can start building your model without having to spend time training it first! You can get greater details on AWS machine learning services, data science use cases, and other aspects in this book – …
Generalization Errors in Machine Learning: Python Examples
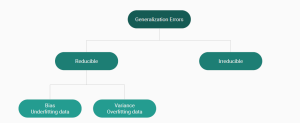
Last updated: 21st Jan, 2024 Machine Learning (ML) models are designed to make predictions or decisions based on data. However, a common challenge, data scientists face when developing these models is ensuring that they generalize well to new, unseen data. Generalization refers to a model’s ability to perform accurately on new, unseen examples after being trained on a limited set of data. When models don’t generalize well, they commit errors. These errors are called generalization errors. In this blog, you will learn about different types of generalization errors, with examples, and walk through a simple Python demonstration to illustrate these concepts. Types of Generalization Errors Generalization errors in machine learning …
Demystifying Encoder Decoder Architecture & Neural Network
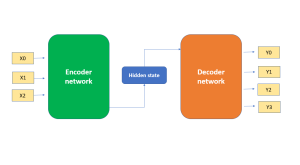
In the field of AI / machine learning, the encoder-decoder architecture is a widely-used framework for developing neural networks that can perform natural language processing (NLP) tasks such as language translation, text summarization, and question-answering systems, etc which require sequence-to-sequence modeling. This architecture involves a two-stage process where the input data is first encoded (using what is called an encoder) into a fixed-length numerical representation, which is then decoded (using a decoder) to produce an output that matches the desired format. In this blog, we will explore the inner workings of the encoder-decoder architecture, how it can be used to solve real-world problems, and some of the latest developments in …
Bag of Words in NLP & Machine Learning: Examples

Last updated: 6th Jan, 2024 Most machine learning algorithms require numerical input for training the models. Bag of words (BoW) effectively converts text data into numerical feature vectors, making it compatible with a wide range of machine learning algorithms, from linear classifiers like logistic regression to complex ones like neural networks. In this post, you will learn about the concepts of bag-of-words model and how to train a text classification model using Python Sklearn. Some of the most common text classification problems includes sentiment analysis, spam filtering etc. In these problems, one can apply bag-of-words technique to train machine learning models for text classification. It will be good to understand the …
Natural Language Processing (NLP) Task Examples
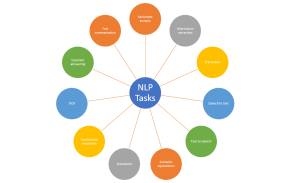
Last updated: 5th Jan, 2024 Have you ever wondered how your phone’s voice assistant understands your commands and responds appropriately? Or how search engines are able to provide relevant results for your queries? The answer lies in Natural Language Processing (NLP), a subfield of artificial intelligence (AI) that focuses on enabling machines to understand and process human language. NLP is becoming increasingly important in today’s world as more and more businesses are adopting AI-powered solutions to improve customer experiences, automate manual tasks, and gain insights from large volumes of textual data. With recent advancements in AI technology, it is now possible to use pre-trained language models such as ChatGPT to …
Cohen Kappa Score Explained: Formula, Example
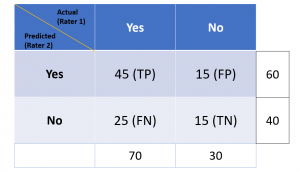
Last updated: 5th Jan, 2024 Cohen’s Kappa Score is a statistic used to measure the performance of machine learning classification models. In this blog post, we will discuss what Cohen’s Kappa Score is and Python code example representing how to calculate Kappa score using Python. We will also provide a code example so that you can see how it works! What is Cohen’s Kappa Score or Coefficient? Cohen’s Kappa Score, also known as the Kappa Coefficient, is a statistical measure of inter-rater agreement for categorical data. Cohen’s Kappa Coefficient is named after statistician Jacob Cohen, who developed the metric in 1960. It is generally used in situations where there …
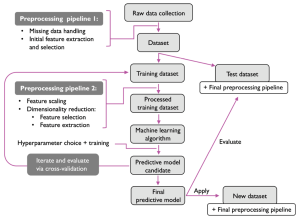
Validation Techniques for Machine Learning Models: Examples
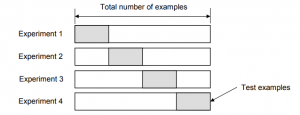
Last updated: 4th Jan, 2024 In the realm of machine learning, the emphasis increasingly shifts towards solving real-world problems with high-quality models. Creating high performant models does not not just depend on raw computational power or theoretical knowledge, but crucially on the ability to systematically conduct and learn from a myriad of different models by trying with hypothesis and related experiments including different algorithms, datasets / features, hyperparameters, etc. This is where the importance of a robust validation strategy and related techniques becomes paramount. Validation techniques, in essence, are the methodologies employed to accurately assess a model’s errors and to gauge how its performance fluctuates with different experiments. The primary …
Machine Learning Definition, Examples, Method, Types
Last updated: 3rd Jan, 2024 Machine learning is a machine’s ability to learn from data. It has been around for decades, but machine learning is now being applied in nearly every industry and job function. In this blog post, we’ll cover a detailed introduction to what is machine learning (ML) including different definitions. We will also learn about different types of machine learning tasks, algorithms, etc along with real-world examples. What is machine learning & how does it work? Definition 1: Simply speaking, machine learning can be defined as an approach to model our beliefs about real-world events. For example, let’s say a person came to a doctor with a …
Machine Learning Models Solution Design: Examples

This blog is crafted for data scientists, machine learning (ML) and software engineers, business analysts / product managers, and anyone involved in the ML project lifecycle, aiming to create a reliable solution design and development strategy / plan for successful AI / machine learning project implementation and value realization. The blog revolves around a series of critical solution design questions, meticulously curated to guide teams from the initial conception of a project to its final deployment and beyond. By addressing each of these solution design questions, teams can ensure that they are not only building a model that is technically proficient but also one that aligns seamlessly with business objectives, …
Micro-average, Macro-average, Weighting: Precision, Recall, F1-Score
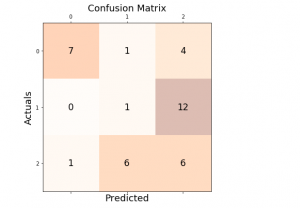
Last updated: 30th Dec, 2023 In this post, you will learn about how to use micro-averaging and macro-averaging methods for evaluating scoring metrics (precision, recall, f1-score) for multi-class classification machine learning problem. You will also learn about weighting method used as one of the other averaging choices of metrics such as precision, recall and f1-score for multi-class classification problem. The concepts will be explained with Python code examples. What & Why of Micro, Macro-averaging and Weighting metrics? Micro and macro-averaging methods are used in the evaluation of classification models, to compute performance metrics like precision, recall, and F1-score. These methods are especially relevant in scenarios involving multi-class or multi-label classification. In case of multi-class classification, …
Mean Squared Error or R-Squared – Which one to use?
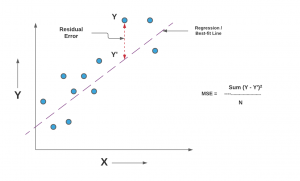
Last updated: 29th Dec, 2023 As you embark on your journey to understand and evaluate the performance of regression models, it’s crucial to know when to use each of these metrics and what they reveal about your model’s accuracy. In this post, you will learn about the concepts of the mean-squared error (MSE) and R-squared (R2), the difference between them, and which one to use when evaluating the linear regression models. Note that MSE is very closely related to root mean squared error (RMSE) which is also discussed in this blog. You also learn Python examples to understand the concepts in a better manner. For learning the differences between other …
Data Science Competitions on Different Online Platforms

Data science / Machine Learning is an ever-evolving field, and competitions provide a great way for beginners / practitioners to hone their skills, solve real-world problems, enhance their resumes / CVs and even earn rewards. Here’s a roundup of some notable machine learning / data science / AI competition platforms, each offering unique opportunities. Each of these data science competition platforms offers unique opportunities and challenges, making them ideal for both beginners and expert data scientists at various stages of their careers to learn, compete, and contribute to a wide array of problems.
Independent Samples T-test: Formula, Examples, Calculator
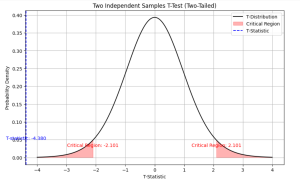
Last updated: 21st Dec, 2023 As a data scientist, you may often come across scenarios where you need to compare the means of two independent samples. In such cases, a two independent samples t-test, also known as unpaired two samples t-test, is an essential statistical tool that can help you draw meaningful conclusions from your data. This test allows you to determine whether the difference between the means of two independent samples is statistically significant or due to chance. In this blog, we will cover the concept of independent samples t-test, its formula, real-world examples of its applications and the Python & Excel example (using scipy.stats.ttest_ind function). We will begin …
Introducing Our New Data Science & AI Trends Page

We are thrilled to announce the launch of our dedicated Data Science and AI Trends page at VitalFlux.com! This new resource is designed to be a one-stop hub for data scientists, AI enthusiasts, and anyone passionate about staying at the forefront of technological innovation. What You’ll Find Our Data Science & AI Trends page is more than just a collection of articles; it’s a dynamic resource that aggregates the most insightful and current information from various high-impact sources. Here’s a sneak peek at what you can expect: Web Pages Stay informed with our selection of web pages from leading research institutions, tech news outlets, and individual thought leaders in the …
Z-test vs T-test: Formula, Examples
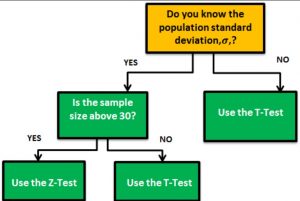
Last updated: 18th Dec, 2023 When it comes to statistical tests, z-test and t-test are two of the most commonly used. But what is the difference between z-test and t-test? And when to use z-test vs t-test? In this relation, we also wonder about z-statistics vs t-statistics. And, the question arises around what’s the difference between z-statistics and t-statistics. In this blog post, we will answer all these questions and more! We will start by explaining the difference between z-test and t-test in terms of their formulas. Then we will go over some examples so that you can see how each test is used in practice. As data scientists, it …
Python – Replace Missing Values with Mean, Median & Mode
Last updated: 18th Dec, 2023 Have you found yourself asking question such as how to deal with missing values in data analysis stage? When working with Python, have you been troubled with question such as how to replace missing values in Pandas data frame? Well, missing values are common in dealing with real-world problems when the data is aggregated over long time stretches from disparate sources, and reliable machine learning modeling demands for careful handling of missing data. One strategy is imputing the missing values, and a wide variety of algorithms exist spanning simple interpolation (mean, median, mode), matrix factorization methods like SVD, statistical models like Kalman filters, and deep …
I found it very helpful. However the differences are not too understandable for me