
Understanding the differences between standard deviation and standard error is crucial for anyone involved in statistical analysis or research. These concepts, while related, serve different purposes in the realm of statistics. In this blog, we will delve into their differences, applications in research, formulas, and practical examples.
Introduction to Standard Deviation & Standard Error
At the heart of statistical analysis lies the need to understand and quantify variability. This is where standard deviation and standard error come into play.
What’s standard deviation?
Standard Deviation is a measure that reflects the amount of variation or dispersion within a dataset. It indicates how much individual data points deviate from the mean (average) of the dataset. In simpler terms, it tells us how spread out the numbers are. The following is a density plot for demonstrating the concept of standard deviation. The red dashed line marks the mean of the dataset, while the green dashed lines indicate one standard deviation above and below the mean.
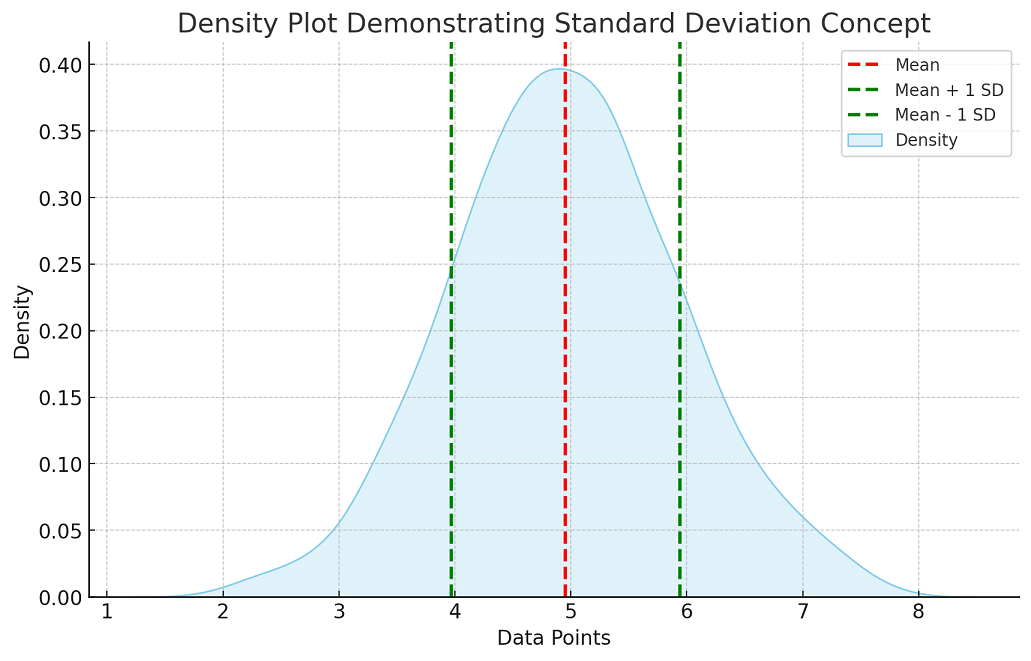
A high standard deviation in a dataset signifies a large spread in the data values, indicating that the data points are widely scattered around the mean. This wide dispersion can suggest a high level of variability within the dataset, implying that individual data points can be significantly different from each other and from the mean. Conversely, a low standard deviation indicates that the data points are closely clustered around the mean, showing that the values in the dataset are more consistent and less variable. In essence, a low standard deviation reflects a high level of predictability and uniformity in the data values.
What’s standard error?
Standard Error, however, measures the precision of the sample mean as an estimate of the population mean. It is the standard deviation of the sampling distribution of a statistic, most commonly the mean. It essentially indicates how much the sample mean would vary if different samples were taken from the same population. The following is a density plot for demonstrating the concept of standard error.
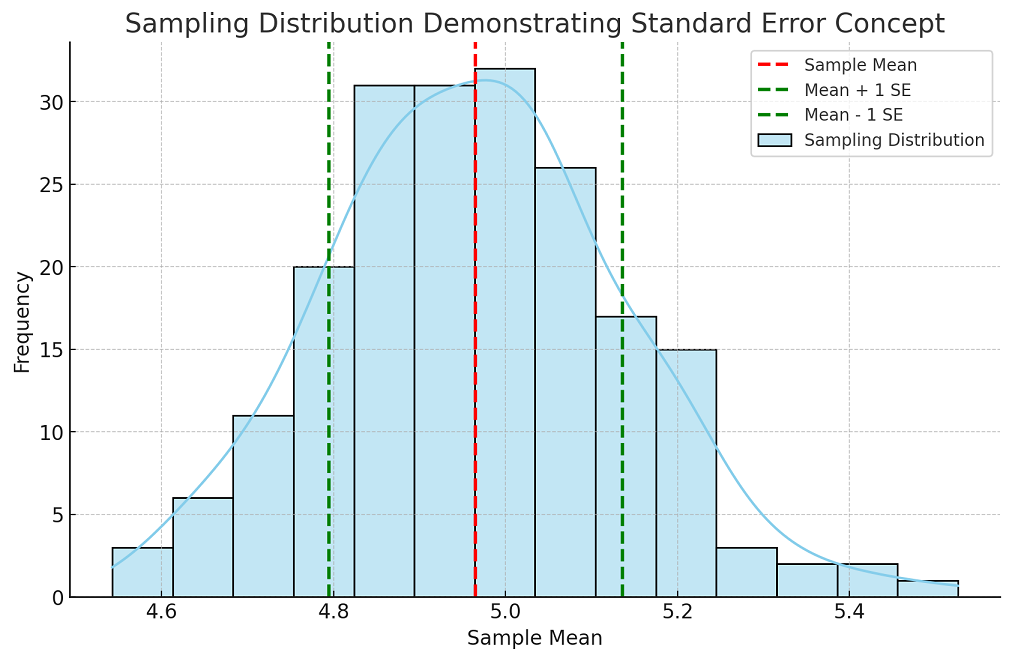
The plot above demonstrates the concept of standard error using a sampling distribution. Here’s how it was created and what it represents:
- Sampling Process: We drew 200 samples, each with a size of 30, from the original dataset. For each sample, we calculated the mean.
- Sampling Distribution: The histogram (with a Kernel Density Estimate overlay) shows the distribution of these sample means. This distribution is centered around the mean of the original dataset.
- Mean and Standard Error:
- The red dashed line represents the mean of these sample means.
- The green dashed lines represent one standard error above and below the sampling distribution mean.
The standard error is the standard deviation of the sample means. This plot illustrates how the sample means tend to cluster around the true mean of the population, and the spread of these sample means (indicated by the standard error) gives an idea of the precision of the sample mean as an estimate of the population mean.
A high standard error indicates a large variance in sample means, suggesting that the sample may not represent the population accurately. Conversely, a low standard error implies a higher precision of the sample mean as an estimate of the population mean.
Formula and Calculations: From Theory to Practice
To practically apply these concepts, understanding the formula of standard error and standard deviation is essential. Here is the formula:
Standard Deviation Formula
The standard deviation is a key statistical measure used to quantify the amount of variation or dispersion in a dataset. It is represented by the Greek letter sigma (σ) and is calculated as the square root of the variance. The formula for standard deviation takes into account each data point in the dataset, measuring how much each one deviates from the mean (average) of the set. The formula is given by:
$\sigma = \sqrt{\frac{\sum (x_i – \bar{x})^2}{N}}$
Where $\sigma$ is the standard deviation, $x_i$ represents each value in the dataset, $\bar{x}$ is the mean of the dataset, and N is the number of values in the dataset.
Standard Error Formula
The standard error of the mean is a statistical term that measures the accuracy with which a sample represents a population. It is derived from the standard deviation and provides a sense of how far the sample mean of the data is likely to be from the true population mean. The standard error decreases as the sample size increases, indicating that larger samples more accurately reflect the population. The formula for the standard error of the mean is:
$SE = \frac{\sigma}{\sqrt{n}}$
Where SE is the standard error, $\sigma$ is the standard deviation of the dataset, and n is the sample size. This formula shows that the standard error is essentially the standard deviation of the sample mean’s distribution.
Differences: Standard Deviation vs Standard Error
The following is the list of differences between standard deviation and standard error:
| Aspect | Standard Deviation | Standard Error |
|---|---|---|
| Definition | Measures the amount of variation or dispersion in a dataset. | Measures the precision of the sample mean as an estimate of the population mean. |
| What It Represents | The spread of individual data points around the mean of a dataset. | The spread of sample means around the true population mean. |
| Calculation | Calculated as the square root of the variance of the dataset. | Calculated using the standard deviation divided by the square root of the sample size. |
| Use in Data Analysis | Used to understand the variability within a single dataset. | Used to understand how accurately a sample represents a population. |
| Implication of High Value | A high standard deviation indicates a wide spread of data points, suggesting high variability within the data. | A high standard error indicates a large variance in sample means, suggesting less precision in estimates. |
| Sample Size Dependency | Independent of the sample size. | Decreases with an increasing sample size, reflecting improved precision. |
When to use Standard Deviation vs Standard Error?
Choosing between standard deviation and standard error depends on the objective of your statistical analysis:
When to Use Standard Deviation:
- Assessing Data Variability: Use standard deviation when you need to understand the variability or dispersion within your dataset. It helps to know how much individual data points deviate from the mean of the dataset.
- Comparing Data Sets: Standard deviation is valuable when comparing the spread of two or more different datasets. For example, comparing the variability of test scores between different classes.
- Data Representation: In situations where you want to represent the data spread graphically (like in a bell curve), standard deviation provides a clear picture of the data distribution.
- General Analysis of Data: When the focus is on the dataset itself, and not on estimating the characteristics of a larger population, standard deviation is the appropriate measure.
When to Use Standard Error:
- Estimating Population Parameters: Use standard error when you’re using sample data to estimate a parameter (like the mean) of a larger population. It’s about understanding the precision of your estimate.
- Constructing Confidence Intervals: In inferential statistics, especially when constructing confidence intervals for population means, standard error is used to determine the margin of error.
- Hypothesis Testing: Standard error is crucial in hypothesis testing, particularly in t-tests, where it helps to determine how far the sample mean deviates from a null hypothesis value.
- When Dealing with Sample Means: If your analysis involves the mean of sample means (such as in meta-analysis or repeated sampling), the standard error is the right choice as it reflects the variability in these sample means.

Check out my latest book titled as First Principles Thinking: Building winning products using first principles thinking.
- Mathematics Topics for Machine Learning Beginners - July 6, 2025
- Questions to Ask When Thinking Like a Product Leader - July 3, 2025
- Three Approaches to Creating AI Agents: Code Examples - June 27, 2025
I found it very helpful. However the differences are not too understandable for me