Category Archives: Python
Support Vector Machine (SVM) Python Example
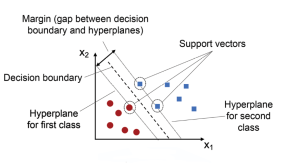
Support Vector Machines (SVMs) are a powerful and versatile machine learning algorithm that has gained widespread popularity among data scientists in recent years. SVMs are widely used for classification, regression, and outlier detection (one-class SVM), and have proven to be highly effective in solving complex problems in various fields, including computer vision (image classification, object detection, etc.), natural language processing (sentiment analysis, text classification, etc.), and bioinformatics (gene expression analysis, protein classification, disease diagnosis, etc.). In this post, you will learn about the concepts of Support Vector Machine (SVM) with the help of Python code example for building a machine learning classification model. We will work with Python Sklearn package for building the …
Hidden Markov Models: Concepts, Examples
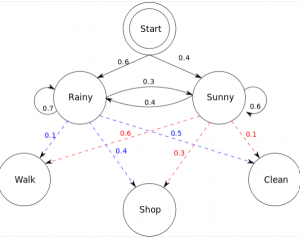
Hidden Markov models (HMMs) are a type of statistical modeling that has been used for several years. They have been applied in different fields such as medicine, computer science, and data science. The Hidden Markov model (HMM) is the foundation of many modern-day data science algorithms. It has been used in data science to make efficient use of observations for successful predictions or decision-making processes. This blog post will cover hidden Markov models with real-world examples and important concepts related to hidden Markov models. What are Markov Models? Markov models are named after Andrey Markov, who first developed them in the early 1900s. Markov models are a type of probabilistic …
Python Pickle Example: What, Why, How

Have you ever heard of the term “Python Pickle“? If not, don’t feel bad—it can be a confusing concept. However, it is a powerful tool that all data scientists, Python programmers, and web application developers should understand. In this article, we’ll break down what exactly pickling is, why it’s so important, and how to use it in your projects. What is Python Pickle? In its simplest form, pickling is the process of converting any object into a byte stream (a sequence of bytes). This byte stream can then be transmitted over a network or stored in a file for later use. It’s like putting the object into an envelope and …
Machine Learning Programming Languages List

If you’re interested in pursuing a career in machine learning, you’ll need to have a firm grasp of at least one programming language. But with so many languages to choose from, which one should you learn? Here are three of the most popular machine learning programming languages, along with a brief overview of each. Python Python is a programming language with many features that make it well suited for machine learning. It has a large and active community of developers who have contributed a wide variety of libraries and tools. Python’s syntax is relatively simple and easy to learn, making it a good choice for people who are new to …
How to Prepare for a Python Interview

Python has become the most popular programming language in the world and is one of the most in-demand languages by employers. It is a widely used high-level interpreted programming language. Its design philosophy emphasizes code readability and its syntax allows programmers to express concepts in fewer lines of code than would be possible in languages such as C++ or Java. The language provides constructs intended to enable clear programs on both a small and large scale. As such, if you’re a Python programmer, you’re likely to face stiff competition when applying for jobs. In order to increase your chances of landing an interview, it’s important to be well prepared. In …
K-Nearest Neighbors (KNN) Python Examples

If you’re working with data analytics projects including building machine learning (ML) models, you’ve probably heard of the K-nearest neighbors (KNN) algorithm. But what is it, exactly? And more importantly, how can you use it in your own AI / ML projects? In this post, we’ll take a closer look at the KNN algorithm and walk through a simple Python example. You will learn about the K-nearest neighbors algorithm with Python Sklearn examples. K-nearest neighbors algorithm is used for solving both classification and regression machine learning problems. Stay tuned! Introduction to K-Nearest Neighbors (K-NN) Algorithm K-nearest neighbors is a supervised machine learning algorithm for classification and regression. In both cases, the input consists …
Stacking Classifier Sklearn Python Example

In this blog post, we will be going over a very simple example of how to train a stacking classifier machine learning model in Python using the Sklearn library and learn the concepts of stacking classifier. A stacking classifier is an ensemble learning method that combines multiple classification models to create one “super” model. This can often lead to improved performance, since the combined model can learn from the strengths of each individual model. What are Stacking Classifiers? Stacking is a machine learning ensemble technique that combines multiple models to form a single powerful model. The individual models are trained on different subsets of the data using some type of …
Decision Tree Hyperparameter Tuning Grid Search Example
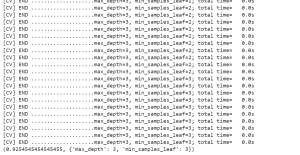
The output prints out grid search across different values of hyperparameters, the model score with best hyperparameters and the most optimal hyperparameters value. In the above code, the decision tree model is train and evaluate our for each value combination and choose the combination that results in the best performance. In this case, “best performance” could be defined as either accuracy or AUC (area under the curve). Once we’ve found the best performing combination of hyperparameters, we can then train our final model using those values and deploy it to production. Conclusion In this blog post, we explored how to use grid search to tune the hyperparameters of a Decision …
Generalized Linear Models Explained with Examples
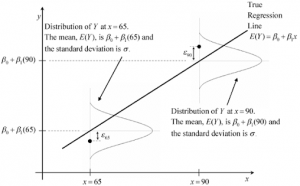
Generalized linear models (GLMs) are a powerful tool for data scientists, providing a flexible way to model data. In this post, you will learn about the concepts of generalized linear models (GLM) with the help of Python examples. It is very important for data scientists to understand the concepts of generalized linear models and how are they different from general linear models such as regression or ANOVA models. What are Generalized Linear Models? Generalized linear models (GLM) are a type of statistical models that can be used to model data that is not normally distributed. It is a flexible general framework that can be used to build many types of regression models, including …
Generate Random Numbers & Normal Distribution Plots
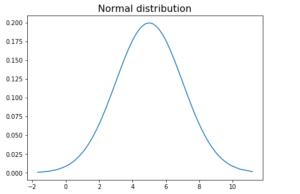
In this blog post, we’ll be discussing how to generate random numbers samples from normal distribution and create normal distribution plots in Python. We’ll go over the different techniques for random number generation from normal distribution available in the Python standard library such as SciPy, Numpy and Matplotlib. We’ll also create normal distribution plots from these numbers generated. Generate random numbers using Numpy random.randn Numpy is a Python library that contains built-in functions for generating random numbers. The numpy.random.randn function generates random numbers from a normal distribution. This function takes size N as in number of numbers to be generated as an input and returns an array of N random …
Pandas: Creating Multiindex Dataframe from Product or Tuples
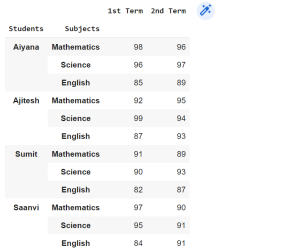
MultiIndex is a powerful tool that enables us to work with higher dimensional data, but it can be tricky to create MultiIndex Dataframes using the from_tuples and from_product function in Pandas. In this blog post, we will be discussing how to create a MultiIndex dataframe using MultiIndex from_tuples and from_product function in Pandas. What is a MultiIndex? MultiIndex is an advanced Pandas function that allows users to create MultiIndexed DataFrames – i.e., dataframes with multiple levels of indexing. MultiIndex can be useful when you have data that can be naturally grouped by more than one category. For example, you might have data on individual employees that can be grouped by …
Top Python Statistical Analysis Packages
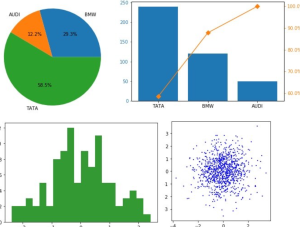
As a data scientist, you know that one of the most important aspects of your job is statistical analysis. After all, without accurate data, it would be impossible to make sound decisions about your company’s direction. Thankfully, there are a number of excellent Python statistical analysis packages available that can make your job much easier. In this blog post, we’ll take a look at some of the most popular ones. SciPy SciPy is a Python-based ecosystem of open-source software for mathematics, science, and engineering. SciPy contains modules for statistics, optimization, linear algebra, integration, interpolation, special functions, Fourier transforms (FFT), signal and image processing, and other tasks common in science and …
Covariance vs. Correlation vs. Variance: Python Examples
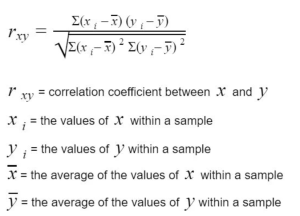
In the field of data science, it’s important to have a strong understanding of statistics and know the difference between related concepts. This is especially true when it comes to the concepts of covariance, correlation, and variance. Whether you’re a data scientist, statistician, or simply someone who wants to better understand the relationships between different variables, it’s important to know the difference between covariance, correlation, and variance. While these concepts may seem similar at first glance, they each have unique applications and serve different purposes. In this blog post, we’ll explore each of these concepts in more detail and provide concrete examples of how to calculate them using Python. What …
Import or Upload Local File to Google Colab
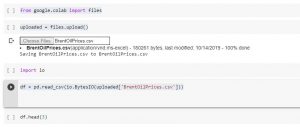
Google Colab is a powerful tool that allows you to run Python code in the cloud. This can be useful for a variety of tasks, including data analysis and machine learning. One of the lesser known features of Google Colab is that you can also import or upload files stored on your local drive. In this article, we will show you how to read a file from your local drive in Google Colab using a quick code sample. There are a few reasons why you as a data scientist might need to learn how to read files from your local drive in Google Colab. One reason is that you may …
Ridge Classification Concepts & Python Examples
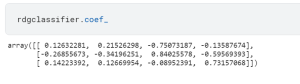
In machine learning, ridge classification is a technique used to analyze linear discriminant models. It is a form of regularization that penalizes model coefficients to prevent overfitting. Overfitting is a common issue in machine learning that occurs when a model is too complex and captures noise in the data instead of the underlying signal. This can lead to poor generalization performance on new data. Ridge classification addresses this problem by adding a penalty term to the cost function that discourage complexity. This results in a model that is better able to generalize to new data. In this post, you will learn about Ridge classifier in detail with the help of …
Pandas Dataframe loc, iloc & brackets examples
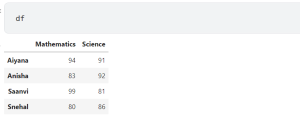
Pandas is a powerful data analysis tool in Python that can be used for tasks such as data cleaning, exploratory data analysis, feature engineering, and predictive modeling. In this article, we will focus on how to use Pandas’ loc and iloc functions on Dataframe, as well as brackets with Dataframe, with examples. As a data scientist or data analyst, it is very important to understand how these functions work and when to use them. In this post, we will work with the following Pandas data frame. Use loc and iloc functions to get Rows of Dataframe The loc function is used to get a particular row in a Dataframe by …
I found it very helpful. However the differences are not too understandable for me