In this blog post, we’ll be discussing how to generate random numbers samples from normal distribution and create normal distribution plots in Python. We’ll go over the different techniques for random number generation from normal distribution available in the Python standard library such as SciPy, Numpy and Matplotlib. We’ll also create normal distribution plots from these numbers generated.
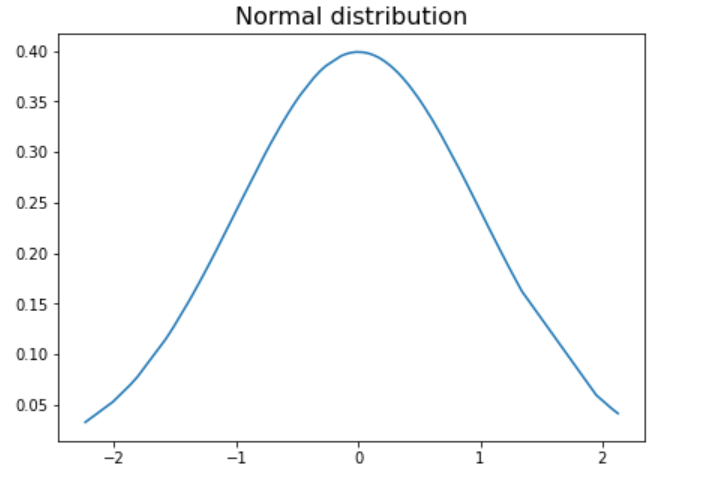
Generate random numbers using Numpy random.randn
Numpy is a Python library that contains built-in functions for generating random numbers. The numpy.random.randn function generates random numbers from a normal distribution. This function takes size N as in number of numbers to be generated as an input and returns an array of N random numbers. The elements of the output array are normally distributed such that they have a mean of 0 and a standard deviation of 1. The distribution is also termed as standard normal distribution. Note that the random number needs to be sorted for creating a smooth plot. Also, note that SciPy’s norm.pdf method is used to generate probability distribution for normal distribution. Norm.pdf can be passed mean (loc) and standard deviation (scale) as well to create normal distribution plot of given mean and standard deviation.
import numpy as np
import matplotlib.pyplot as plt
from scipy.stats import norm
#
# Draw random samples from standard normal distribution
#
x = np.random.randn(100)
#
# Plot probability distribution function
#
x_sorted = np.sort(x)
plt.figure(figsize=(7, 5))
plt.plot(x_sorted, norm.pdf(x_sorted))
plt.title("Normal distribution", fontsize=16)
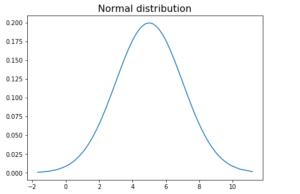
Generate random numbers using Numpy random.normal
The numpy.random.normal function generates random numbers from this distribution. The parameters of the function specify the mean and standard deviation of the distribution. The function also takes an size parameter, which specifies the shape of the array of generated numbers. Unlike random.randn method, random.normal method on Numpy is used to generate random samples of normal ddistribution with a given value of mean and standard deviation. In the code below, loc is used to specify mean and scale is used to specify standard deviation. The same is also passed to norm.pdf function.
import numpy as np
import matplotlib.pyplot as plt
from scipy.stats import norm
#
# Draw random samples from normal distribution
# with a predefined mean and standard deviation
#
x = np.random.normal(loc=5, scale = 2, size=1000)
#
# Plot probability distribution function
#
x_sorted = np.sort(x)
plt.figure(figsize=(7, 5))
plt.plot(x_sorted, norm.pdf(x_sorted, loc=5, scale=2))
plt.title("Normal distribution", fontsize=16)
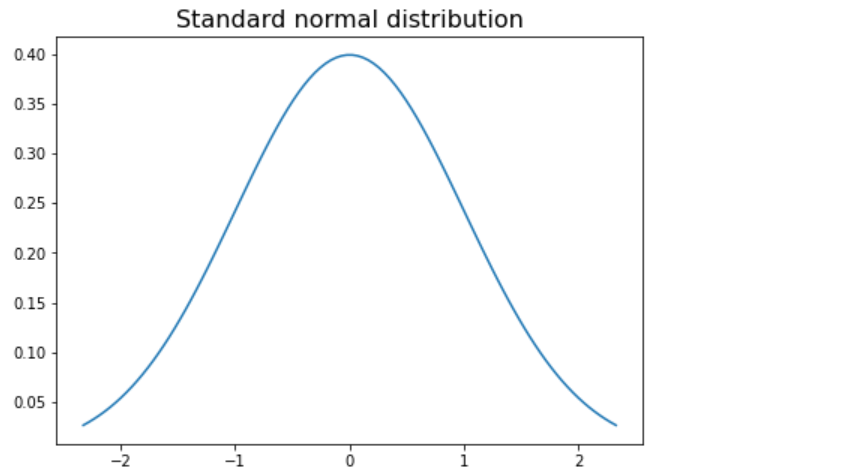
Generating Numbers in Standard Normal Distribution using SciPy Norm.ppf
Numbers are generated using Numpy linspace method. The input to linspace method is lower and upper range which are passed as output of SciPy norm.ppf function. Scipy Norm.ppf function takes as input a desired probability, and returns a number that has that probability of occurring under a standard normal distribution. This happens when no mean and standard deviation values are passed to norm.ppf method. The default mean is 0 and standard deviation is 1 for standard normal distribution. For example, if we want to generate a number that has a 90% chance of occurring, we would use Scipy Norm.ppf(0.9). This would return a value of 1.28, which means that there is a 90% chance that a randomly generated number will be less than or equal to 1.28. Scipy Norm.ppf can be used to generate numbers with any desired probability, making it a versatile tool for statisticians.
import numpy as np
import matplotlib.pyplot as plt
from scipy.stats import norm
#
# Generate numbers in well-defined range using
# norm.ppf method
#
x = np.linspace(norm.ppf(0.01), norm.ppf(0.99), 100)
#
# Create standard normal distribution plot
#
plt.figure(figsize=(7, 5))
plt.plot(x, norm.pdf(x))
plt.title("Standard normal distribution", fontsize=16)
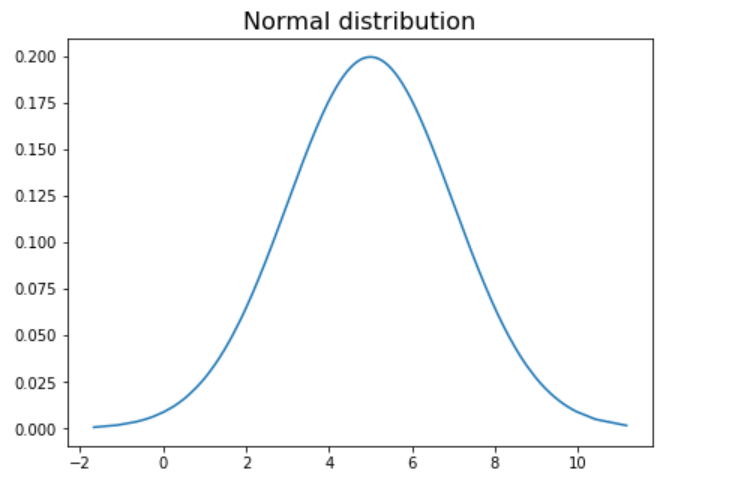
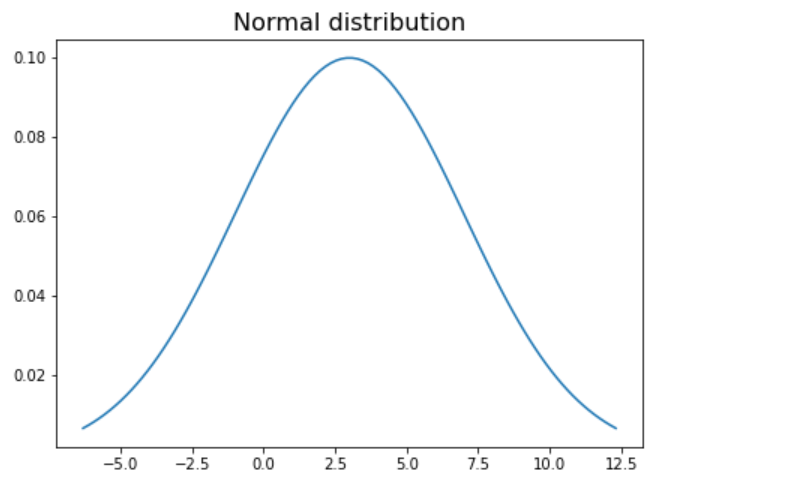
Generating Numbers in Normal Distribution using Scipy Norm.ppf
The difference from the previous method is specific values of mean and standard deviation passed to both norm.ppf and norm.pdf method.
import numpy as np
import matplotlib.pyplot as plt
from scipy.stats import norm
#
# Generate numbers in well-defined range for a given mean and std using
# norm.ppf method
#
mean = 3
std = 4
x = np.linspace(norm.ppf(0.01, loc=mean, scale=std),
                norm.ppf(0.99, loc=mean, scale=std),
                100)
#
# Create normal distribution plot
#
plt.figure(figsize=(7, 5))
plt.plot(x, norm.pdf(x, loc=mean, scale=std))
plt.title("Normal distribution", fontsize=16)
Conclusion
In this blog post, we’ve shown you how to generate random numbers belonging to normal distribution and create plots of the normal distribution in Python. We hope you found this helpful!

Check out my latest book titled as First Principles Thinking: Building winning products using first principles thinking.
- Questions to Ask When Thinking Like a Product Leader - July 3, 2025
- Three Approaches to Creating AI Agents: Code Examples - June 27, 2025
- What is Embodied AI? Explained with Examples - May 11, 2025
I found it very helpful. However the differences are not too understandable for me