KNN vs Logistic Regression: Differences, Examples
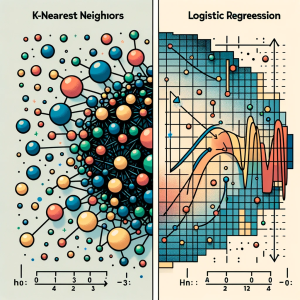
In this blog, we will learn about the differences between K-Nearest Neighbors (KNN) and Logistic Regression, two pivotal algorithms in machine learning, with the help of examples. The goal is to understand the intricacies of KNN’s instance-based learning and Logistic Regression‘s probability modeling for binary and multinomial outcomes, offering clarity on their core principles. We will also navigate through the practical applications of K-NN and logistic regression algorithms, showcasing real-world examples in various business domains like healthcare and finance. Accompanying this, we’ll provide concise Python code samples, guiding you through implementing these algorithms with datasets. This dual focus on theory and practicality aims to equip you with both the understanding …
6 Types of Brainstorming Techniques for Ideas Generation

Last updated: 1st Dec, 2023 Generating innovative and creative ideas is a key component of success in many fields, from business and marketing to science, technology, and the arts. However, the process of coming up with new and unique ideas can be challenging, especially when faced with deadlines, limited resources, or creative blocks. This is where brainstorming or mindstorming comes into picture. Fortunately, there are several different types of brainstorming techniques that can help individuals and teams generate great ideas and innovate. While brainstorming is one of the most effective techniques out there, not all brainstorming sessions are created equal. The question that is frequently asked is how to brainstorm for effective …
Python – How to Create Scatter Plot with IRIS Dataset

Last updated: 1st Dec, 2023 In this blog post, we will be learning how to create a Scatter Plot with the IRIS dataset using Python. The IRIS dataset is a collection of data that is used to demonstrate the properties of various statistical models. It contains information about 50 observations on four different variables: Petal Length, Petal Width, Sepal Length, and Sepal Width. As data scientists, it is important for us to be able to visualize the data that we are working with. Scatter plots are a great way to do this because they show the relationship between two variables. In this post, we learn how to plot IRIS dataset …
Chebyshev’s Theorem: Formula & Examples
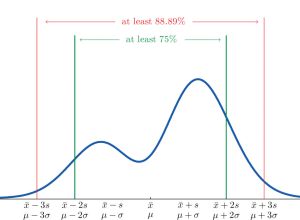
Chebyshev’s theorem is a fundamental concept in statistics that allows us to determine the probability of data values falling within a certain range defined by mean and standard deviation. This theorem makes it possible to calculate the probability of a given dataset being within K standard deviations away from the mean. It is important for data scientists, statisticians, and analysts to understand this theorem as it can be used to assess the spread of data points around a mean value. What is Chebyshev’s Theorem? Chebyshev’s Theorem, also known as Chebyshev’s Rule, states that in any probability distribution, the proportion of outcomes that lie within k standard deviations from the mean …
AIC in Logistic Regression: Formula, Example

Have you as a data scientist ever been challenged by choosing the best logistic regression model for your data? As we all know, the difference between a good and the best model while training machine learning model can be subtle yet impactful. Whether it’s predicting the likelihood of an event occurring or classifying data into distinct categories, logistic regression provides a robust framework for analysts and researchers. However, the true power of logistic regression is harnessed not just by building models, but also by selecting the right model. This is where the Akaike Information Criterion (AIC) comes into play. In this blog, we’ll delve into different aspects of AIC, decode …
Types of SQL Joins: Differences, SQL Code Examples
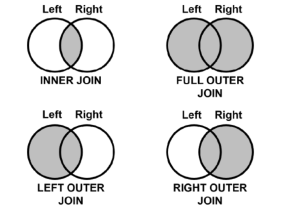
Structured Query Language (SQL) is one of the most important and widely used tools for data manipulation. It allows users to interact with databases, query and manipulate data, and create reports. One of SQL’s most important features is its ability to join tables together in order to enrich, compare and analyze related data. These joins are termed as inner join, outer join, left join and right join. In this article, we will discuss the different types of joins available in SQL, their differences and provide examples of how each can be used. What is SQL Join? SQL Joins are a technique used in Structured Query Language (SQL) to combine two …
30+ Logistic Regression Interview Questions & Answers

Last updated: 29th Nov, 2023 This page lists down the practice tests / interview questions and answers for Logistic regression in machine learning. Those wanting to test their machine learning knowledge in relation with logistic regression would find these practice tests very useful. The goal for these practice tests is to help you check your knowledge in logistic regression machine learning models from time-to-time. More importantly, when you are preparing for interviews, these practice tests are intended to be handy enough. Those going for freshers / intern interviews in the area of machine learning would also find these practice tests / interview questions to be very helpful. These test primarily focus on …
Standard Deviation vs Standard Error: Formula, Examples
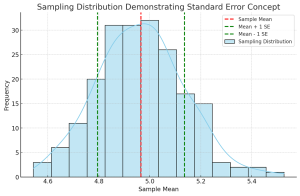
Understanding the differences between standard deviation and standard error is crucial for anyone involved in statistical analysis or research. These concepts, while related, serve different purposes in the realm of statistics. In this blog, we will delve into their differences, applications in research, formulas, and practical examples. Introduction to Standard Deviation & Standard Error At the heart of statistical analysis lies the need to understand and quantify variability. This is where standard deviation and standard error come into play. What’s standard deviation? Standard Deviation is a measure that reflects the amount of variation or dispersion within a dataset. It indicates how much individual data points deviate from the mean (average) …
Coefficient of Variation vs Standard Deviation
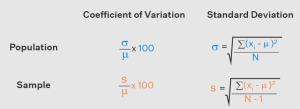
Last updated: 28th Nov, 2023 Understanding the difference between coefficient of variation (CV) and standard deviation (SD) is essential for statisticians and data scientists. While both concepts measure variability in a dataset, they are calculated differently and can be used in different scenarios for better understanding. Here, we will explore the coefficient of variation vs standard deviation differences to gain a better understanding of how to use them. Coefficient of Variation vs Standard Deviation Coefficient of Variation (CV) is a measure that is used to compare the amount of variation in a dataset relative to its mean value. It is calculated by taking the standard deviation divided by the mean, then …
Classification Problems in Machine Learning: Examples

In this post, you will learn about some popular and most common real-life examples of machine learning (ML) classification problems. For beginner data scientists, these examples of classification problems will prove to be helpful to gain perspectives on real-world problems which can be solved using classification algorithms in machine learning. This post will be updated from time-to-time to include interesting examples which can be solved by training classification models. Before going ahead and looking into examples, let’s understand a little about what is an ML classification problem. You may as well skip this section if you are familiar with the definition of machine learning classification problems & solutions. You may …
Z-test vs T-test vs Chi-square test: Differences, Examples
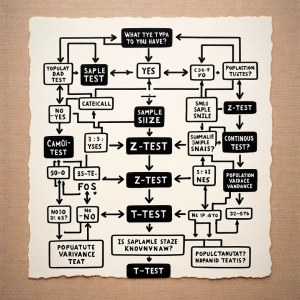
In the world of data science, understanding the differences between various statistical tests is crucial for accurate data analysis. Three most popular tests – the Z-test, T-test, and Chi-square test – each serve specific purposes. This blog post will delve into their definitions, types, formulas, appropriate usage scenarios, and the Python/R packages that can be used for their implementation, along with real-world examples. Check out a detailed post on the differences between Z-test vs T-test. Definition: What’s Z-test vs T-test vs Chi-square test? The following represents the definition of each of the tests along with a real-world example: Z-test: The Z-test is a statistical test used to determine if there …
What is Web3.0? Features, Design, Skills, NFTs

Last updated: 27th Nov, 2023 What is Web3.0? Web3.0 is the next phase of the internet, which focuses on decentralization and security. It includes new technologies like blockchain, which is revolutionizing how we interact with the internet. To be successful in this new era of the Web 3.0 internet, you will need to have a variety of different skills. In this blog post, we will discuss what those skills are and how you can acquire them! What is Web 3.0? Web 1.0 was characterized by its static content delivery, offering a largely read-only experience to users. In contrast, Web 2.0 marked a significant shift towards interactivity, user-generated content, and the …
Learning Curves Python Sklearn Example
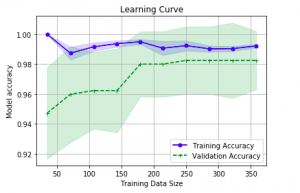
Last updated: 26th Nov, 2023 In this post, you will learn about how to use learning curves to assess the improvement in learning performance (accuracy, error rate, etc.) of a machine learning model while implementing using Python (Sklearn) packages. Knowing how to use learning curves will help you assess/diagnose whether the model is suffering from high bias (underfitting) or high variance (overfitting) and whether increasing training data samples could help solve the bias or variance problem. You may want to check some of the following posts in order to get a better understanding of bias-variance and underfitting-overfitting. Bias-variance concepts and interview questions Overfitting/Underfitting concepts and interview questions What are learning curves? …
Procurement Analytics Use Cases Examples

Last updated: 26th Nov, 2023 The procurement analytics applications is seeing tremendous growth in last few years. With so much data available, advancement in data analytics and related technology field, and the need for digital transformation across procurement organizations, it’s important to know how procurement analytics can help you make better business decisions. This blog will cover procurement analytics and key use cases examples from advanced analytics field such as machine learning, AI, generative AI that will be useful for business stakeholders such as category managers, sourcing managers, supplier relationship managers, business analysts/product managers, and data scientists to implement different use cases using machine learning. The use cases around data-driven decision …
XGBoost Classifier Explained with Python Example
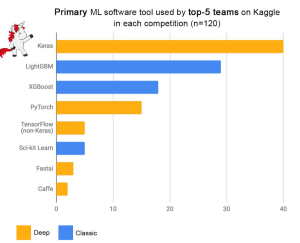
Among the myriad of machine learning algorithms and techniques available with data scientists, one stands out for its exceptional performance in classification problems: XGBoost, short for eXtreme Gradient Boosting. This algorithm has established itself as a force to reckon with in the data science community, as evidenced by its frequent use and high placements in Kaggle competitions, a platform where data scientists and machine learning practitioners worldwide compete to solve complex data problems. The following plot is taken from Francois Chollet tweet. Above demonstrates the prominence of XGBoost as one of the primary machine learning software tools used by the top-5 teams across 120 Kaggle competitions. The data points in …
Data Science Explained: Framework, Methods, Examples
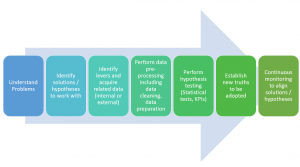
What is data science? This is a question that many people who are planning to start learning data science are asking, and for good reason. Data science is increasingly being applied to solve real-world issues, encompassing a broad range of areas. In this blog post, we’re going to explore data science: what it is, the methods it employs, and how it’s applied to solve various problems, with relevant examples. Stick with us, and by the end of this post, you’ll gain a comprehensive understanding of data science and its significance! What is Data Science? Before understanding what is data science, let’s understand what is science? Science can be defined as …
I found it very helpful. However the differences are not too understandable for me