Last updated: 1st Dec, 2023
In this blog post, we will be learning how to create a Scatter Plot with the IRIS dataset using Python. The IRIS dataset is a collection of data that is used to demonstrate the properties of various statistical models. It contains information about 50 observations on four different variables: Petal Length, Petal Width, Sepal Length, and Sepal Width. As data scientists, it is important for us to be able to visualize the data that we are working with. Scatter plots are a great way to do this because they show the relationship between two variables. In this post, we learn how to plot IRIS dataset in Python with the help of scatter plot using Matplotlib library.
What is IRIS dataset?
IRIS is a multivariate dataset introduced by Ronald Fisher in his 1936 paper, the use of multiple measurements in taxonomic problems as an example of linear discriminant analysis. It is sometimes called Anderson’s IRIS data set because Edgar Anderson gathered the data to evaluate / quantify the morphologic variation of Iris flowers of three related species. Two of the three species were collected in the Gaspe Peninsula “all from the same pasture, and picked on the same day and measured at the same time by the same person with the same apparatus”.
The IRIS dataset is a collection of 150 records of Iris flowers. Each record includes four attributes / features: the petal length and width, and the sepal length and width. The goal is to use iris dataset to train a classification machine learning model which can predict the type of Iris flower based on the given features. There are three types of Iris flowers in the dataset represented by 50 records each: Iris setosa, Iris virginica, and Iris versicolor. The IRIS dataset classification is a popular choice for building classification model from educational / learning standpoint because it is small and easy to work with, but still provides enough data to produce meaningful results.
How to load IRIS Dataset in Python
The following code demonstrates how to load iris data set in python. First and foremost, you need to import iris data set from sklearn.datasets. And, then load_iris() method is called. Note that sklearn.datasets in Python provides a variety of datasets for use in testing and learning machine learning algorithms. Note the code print(IRIS.DESCR) which is used to print iris dataset description including dataset overview, summary, classes, attributes etc.
from sklearn.datasets import load_iris
iris = load_iris()
print(iris.DESCR)
Creating Scatter Plot with IRIS dataset
As discussed earlier, IRIS has remained a popular test case for many statistical classification techniques, especially methods such as support vector machines. This is largely because it is very easy to visualize what is happening in a 2-dimensional or even 3-dimensional space. With just 4 features, you can easily plot each data point on a graph and get a feel for which classifications will be easy and which will be difficult.
A Scatter plot is a graph in which the data points are plotted on a coordinate grid and the pattern of the resulting points reveals important information about the data set. The data points may be randomly distributed, or they may form a distinct pattern. Scatter plots are useful for identifying trends, relationships, and outliers in data sets. They can also be used to compare two or more data sets. Scatter plots are typically used with large data sets, as the patterns that emerge can be difficult to see with smaller data sets.
The following Python code demonstrates how to create scatter plot using IRIS dataset. Note the method iloc invoked on dataframe. It is used to access and read the individual attributes in iris dataset.
%matplotlib inline
import matplotlib.pyplot as plt
import numpy as np
import pandas as pd
from sklearn.datasets import load_iris
iris = load_iris()
df= pd.DataFrame(data= np.c_[iris['data'], iris['target']],
columns= iris['feature_names'] + ['target'])
# select setosa and versicolor
y = df.iloc[0:100, 4].values
y = np.where(y == 'Iris-setosa', 0, 1)
# extract sepal length and petal length
X = df.iloc[0:100, [0, 2]].values
# plot data
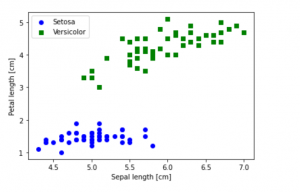
plt.scatter(X[:50, 0], X[:50, 1],
color='blue', marker='o', label='Setosa')
plt.scatter(X[50:100, 0], X[50:100, 1],
color='green', marker='s', label='Versicolor')
plt.xlabel('Sepal length [cm]')
plt.ylabel('Petal length [cm]')
plt.legend(loc='upper left')
# plt.savefig('images/02_06.png', dpi=300)
plt.show()
The following represents the scatter plot which gets created by executing the above Python code:

Here is another method of how to load and read IRIS dataset in Pandas dataframe:
import pandas as pd
#
# IRIS data
#
url = 'https://archive.ics.uci.edu/ml/machine-learning-databases/iris/iris.data'
#
# Create a dataframe
#
df = pd.read_csv(url,header=None,encoding='utf-8')
#
# Print head
#
df.head()
You can read a detailed post on creating Scatter plot using Python Matplotlib library in this post – Scatter plot Matplotlib Python example. If you have any questions about this tutorial or scatter plots in Python, please let us know in the comments below. We love getting feedback from our readers and helping out where we can. Happy plotting!

Check out my latest book titled as First Principles Thinking: Building winning products using first principles thinking.
- Mathematics Topics for Machine Learning Beginners - July 6, 2025
- Questions to Ask When Thinking Like a Product Leader - July 3, 2025
- Three Approaches to Creating AI Agents: Code Examples - June 27, 2025
I found it very helpful. However the differences are not too understandable for me